How To Decipher Aviation Weather
Interpreting aviation weather sources is a vital skill for any pilot, we must become mini-meteorologists in the pursuit of honing our craft.
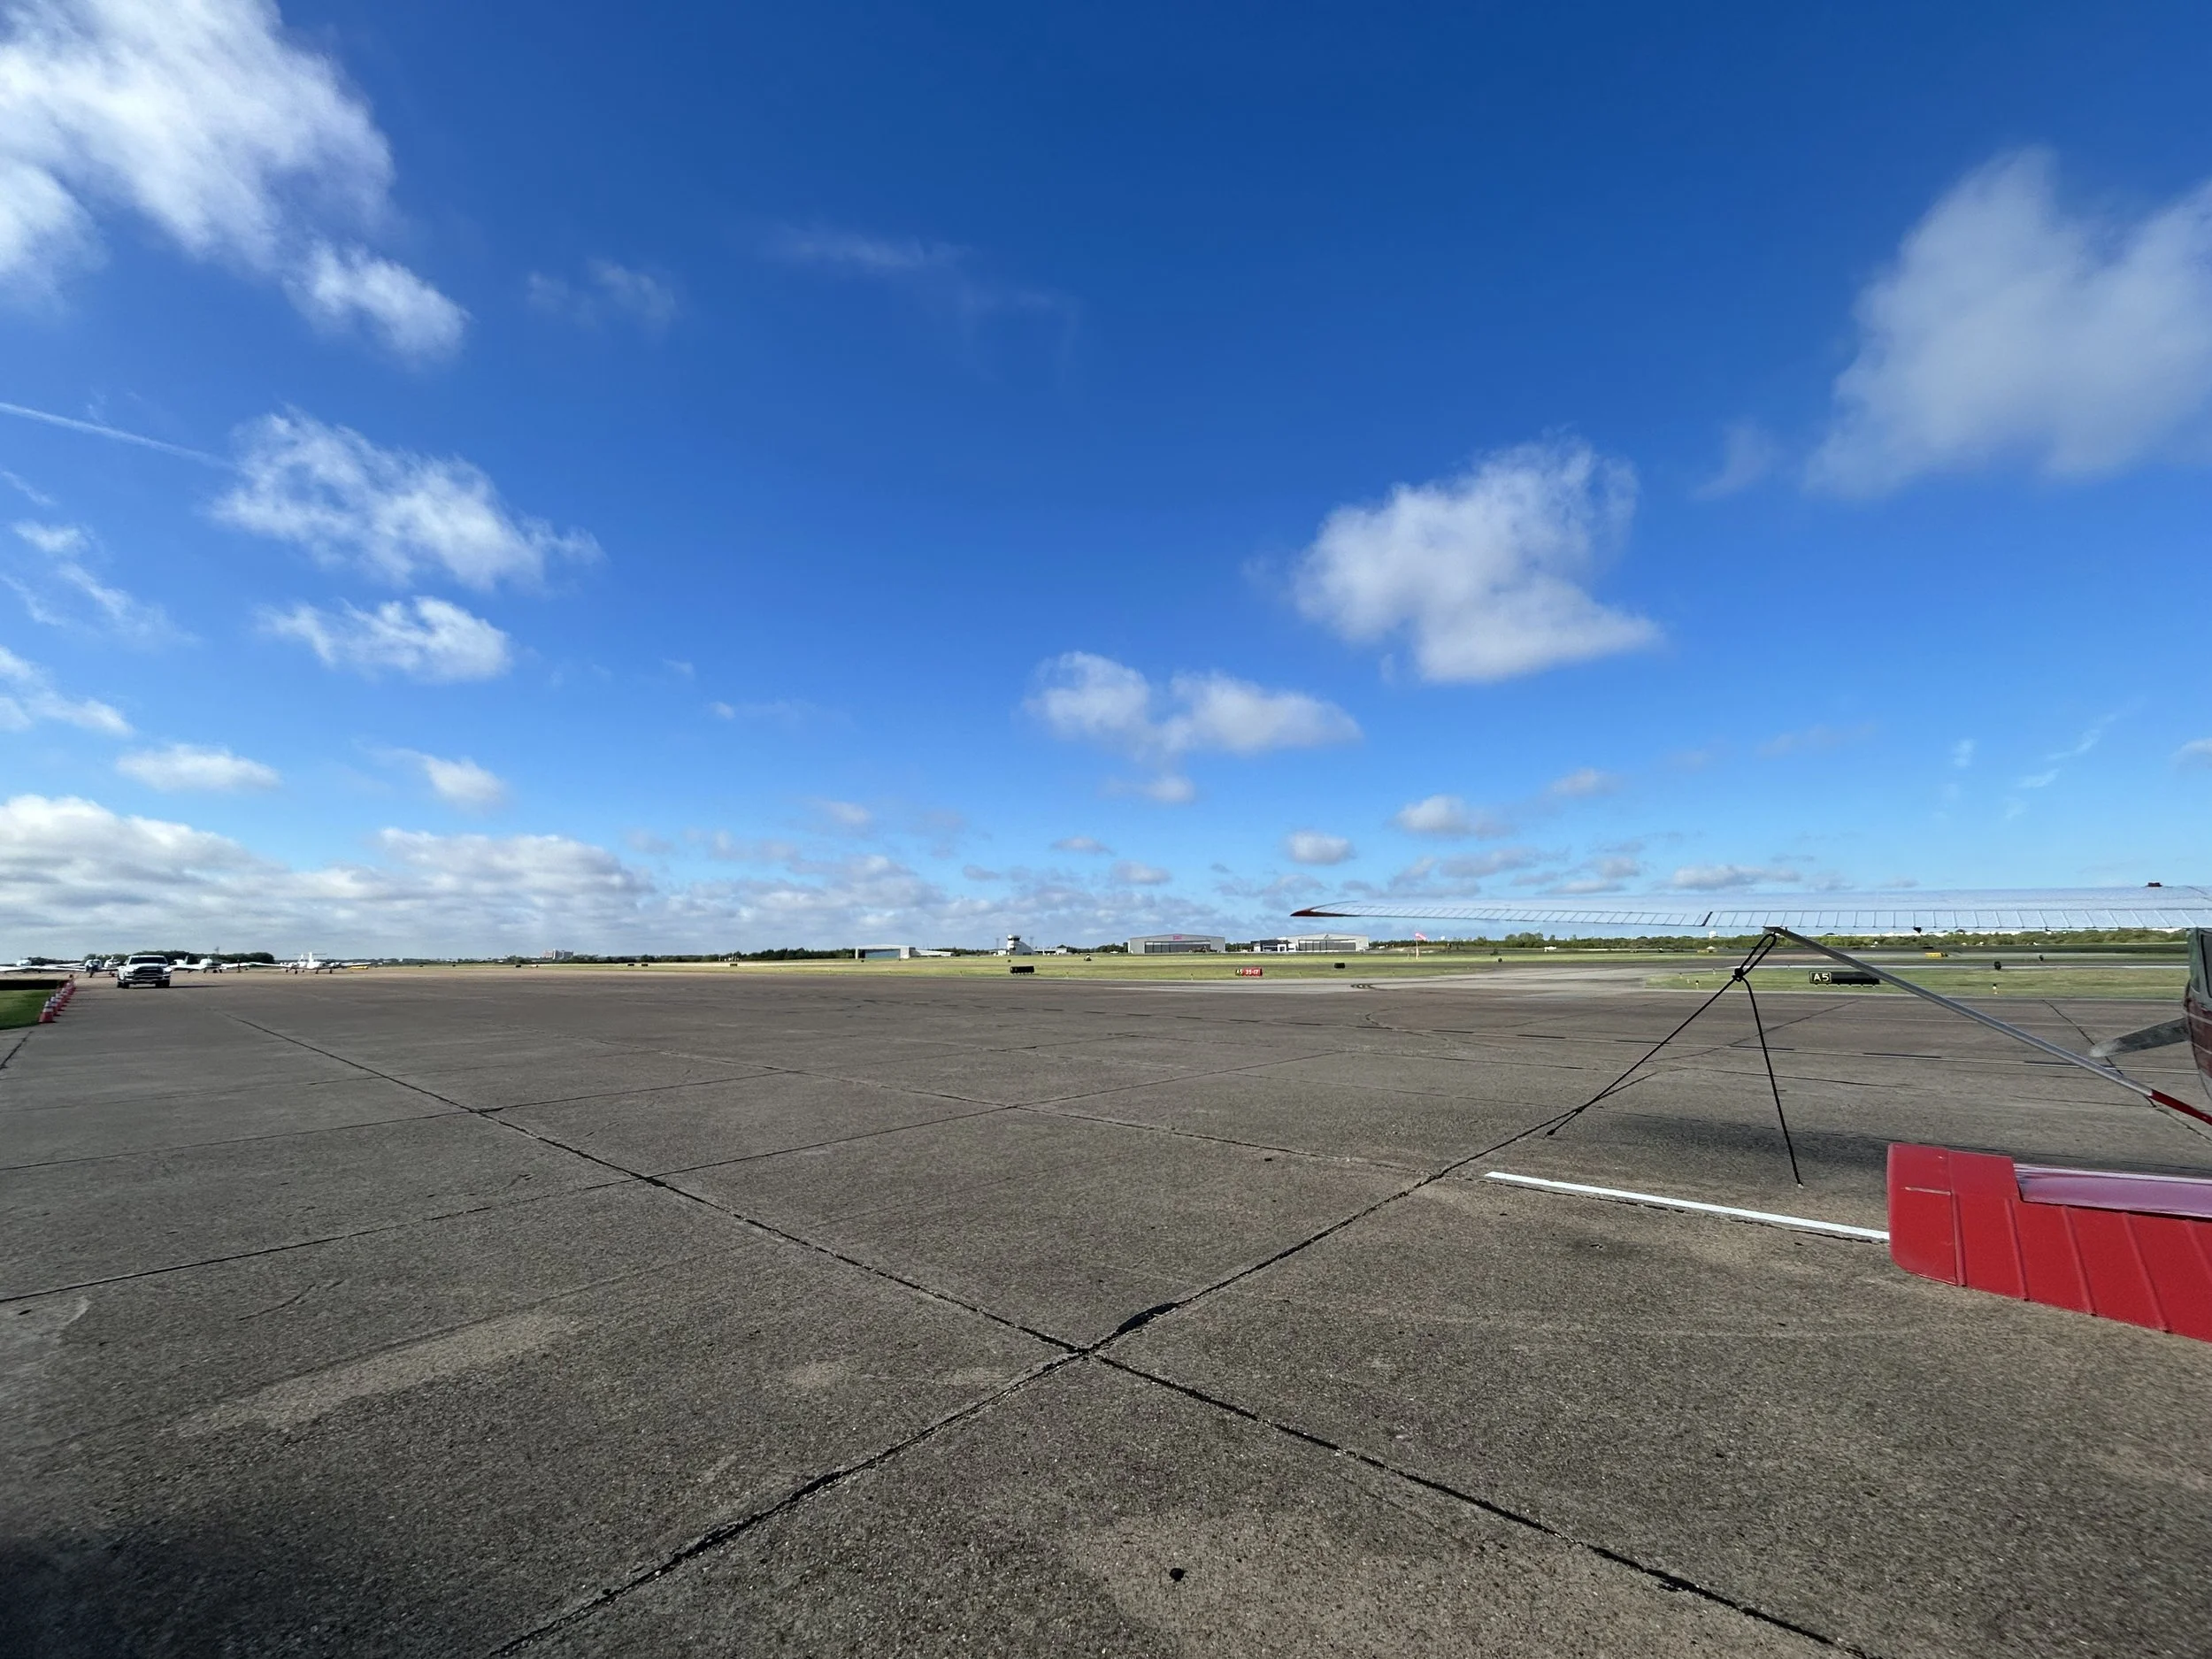
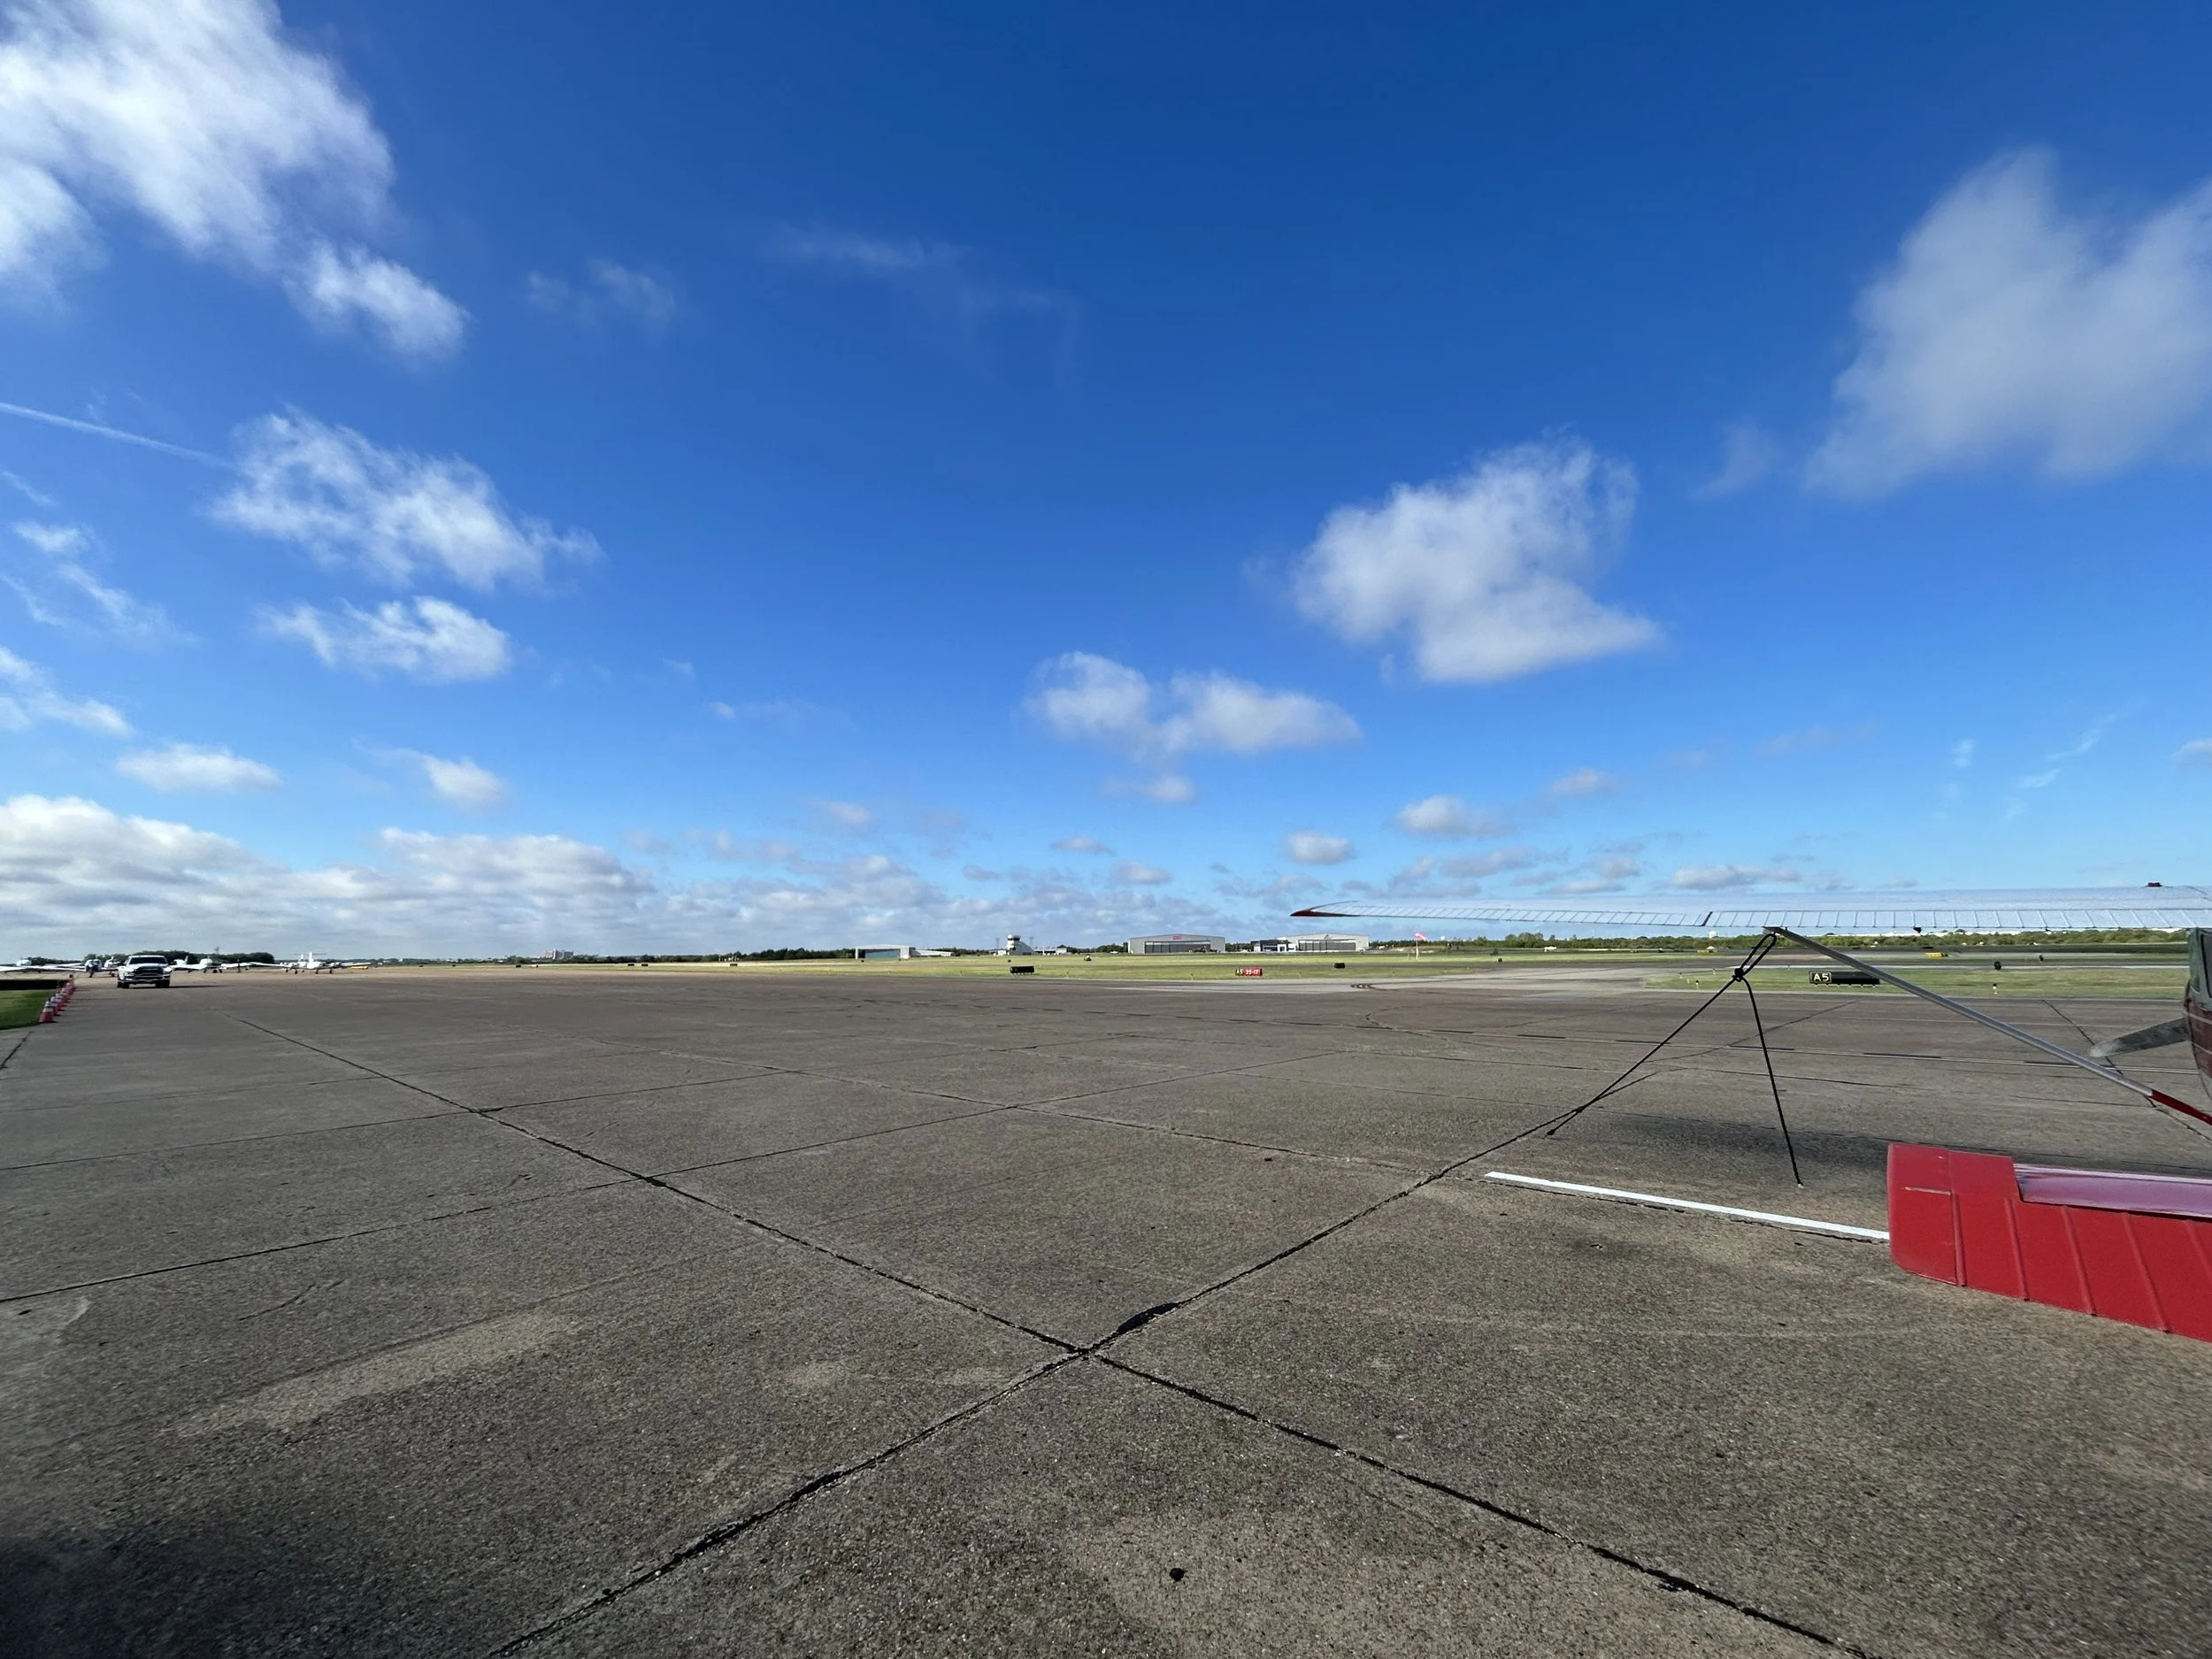
A great way to develop this skill set is to compare your aviation weather sources to a real snapshot of what the sky looks like outside.
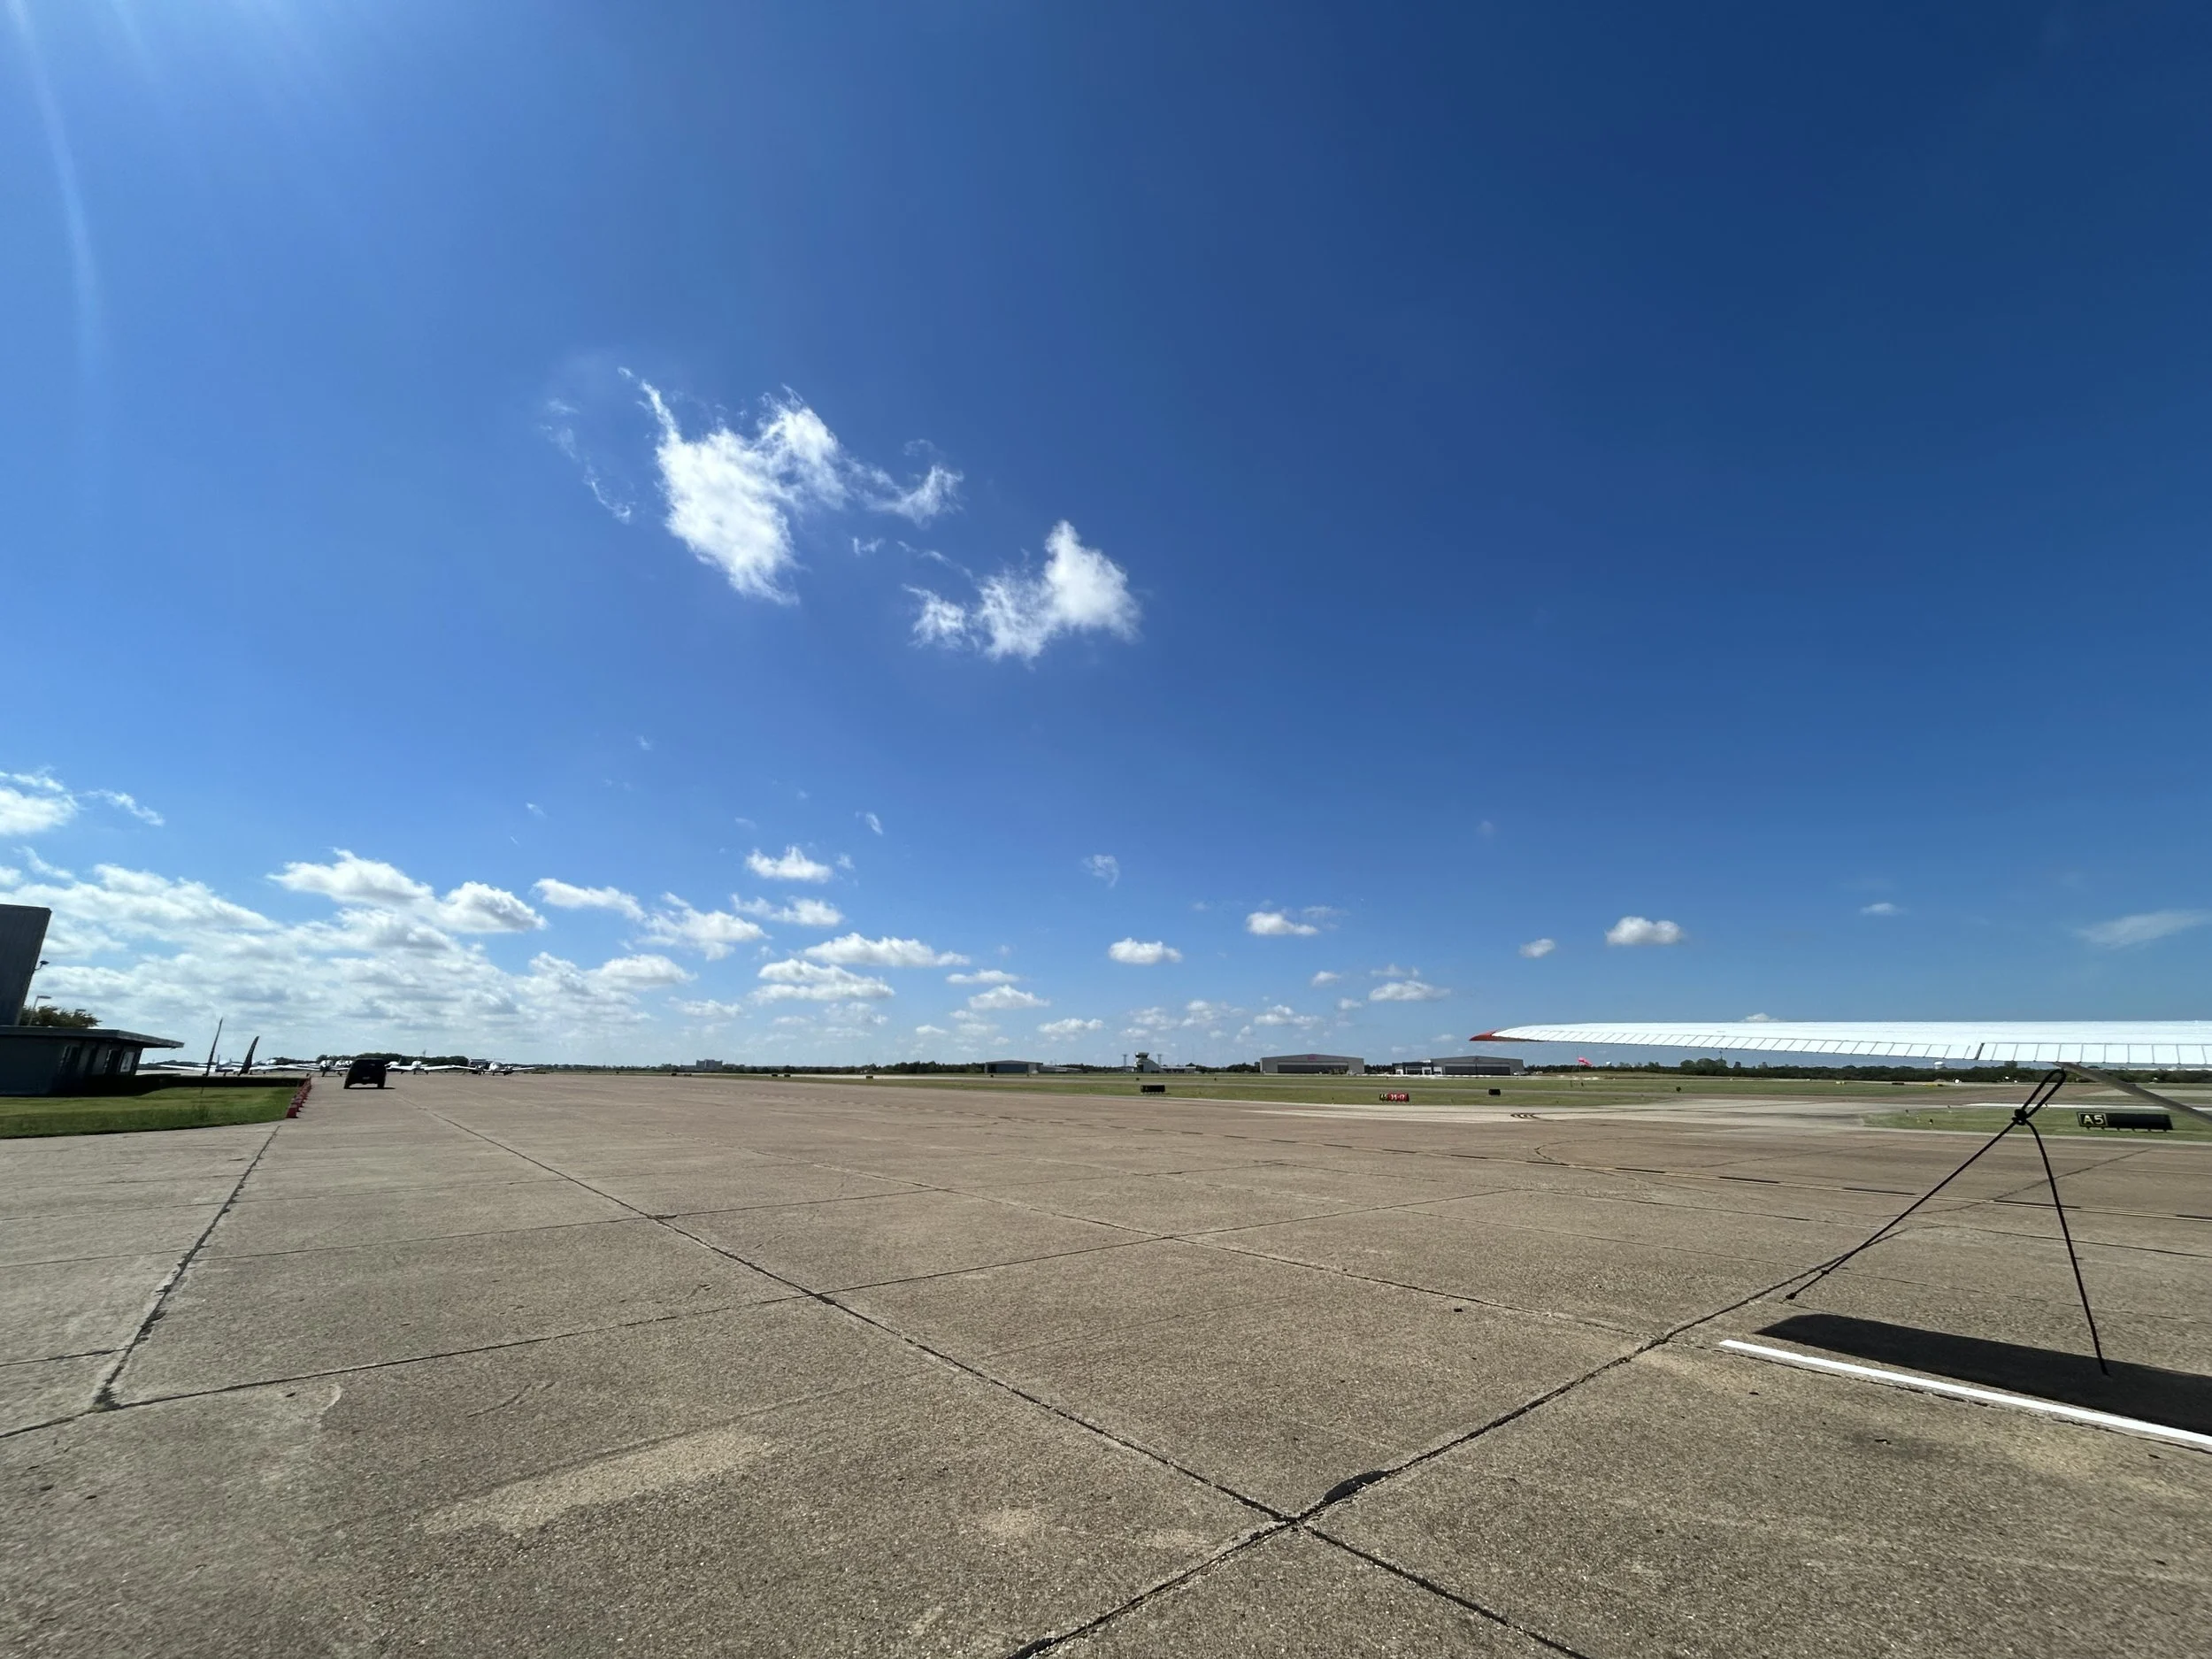
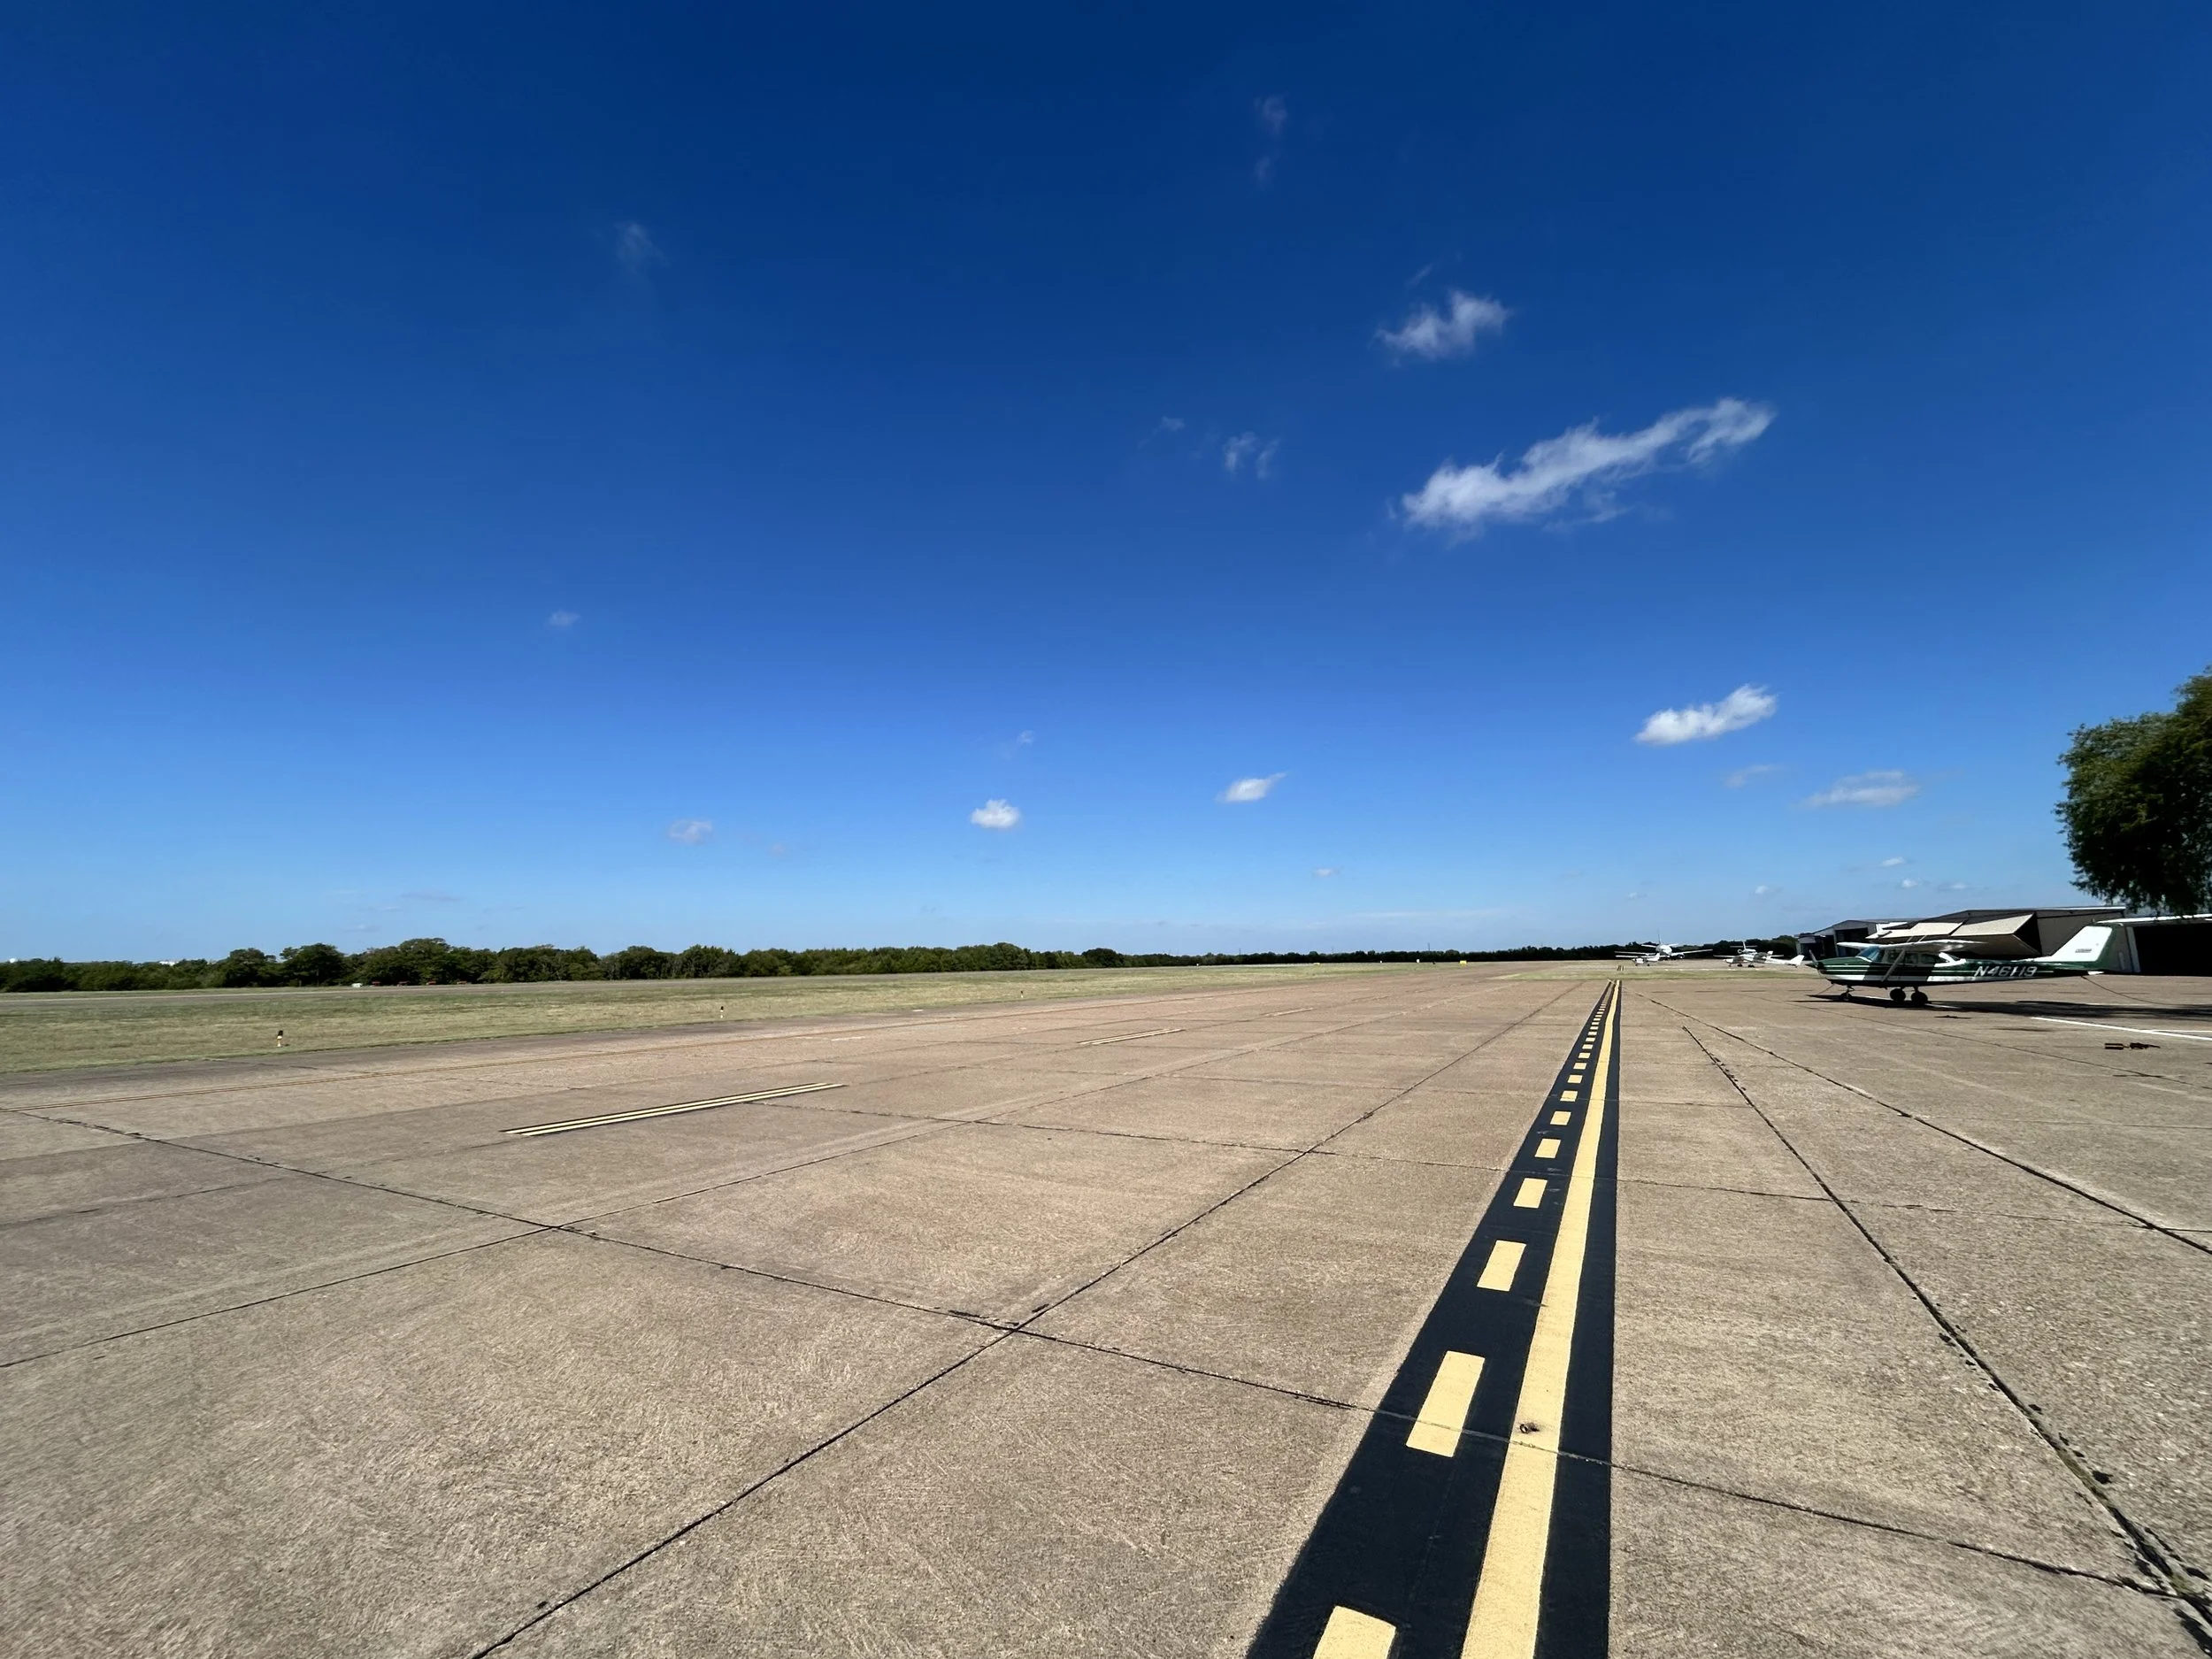
Snapshot of the sky at 10a local on September 23rd, 2025 at Dallas Executive Airport.
I would like to give you a list of questions to ask in your preflight preparation. As we know CFR 91.103 demands that the pilot apprise themself of all knowledge under the sun pertaining to their flight. “CFR 91.103 Preflight Action. Each pilot in command shall, before beginning a flight, become familiar with all available information concerning that flight.”
While this may or may not be possible, we can do our best and go above and beyond the spirit of the law.
Weather Interpretation Checklist
From a macro level, what is happening along the route of flight? (Prognostic Chart)
Is the local air mass stable or unstable? (Winds aloft, Radiosonde sounding)
Is the local air mass dry or moist? (Winds aloft, Radiosonde sounding)
What is the current local and surrounding weather? (METAR)
What is the current forecast weather? (TAF)
Are there any significant threats? (High surface wind, thunderstorm, IFR, turbulence, icing, etc)
Does the sky agree when I look outside?
By answering these questions from a macro to micro level, using the proper sources, understanding what they are telling you, and confirming by looking outside, you can be relatively confident that you know what is happening in the great big sky today.
Macro - Prog Chart
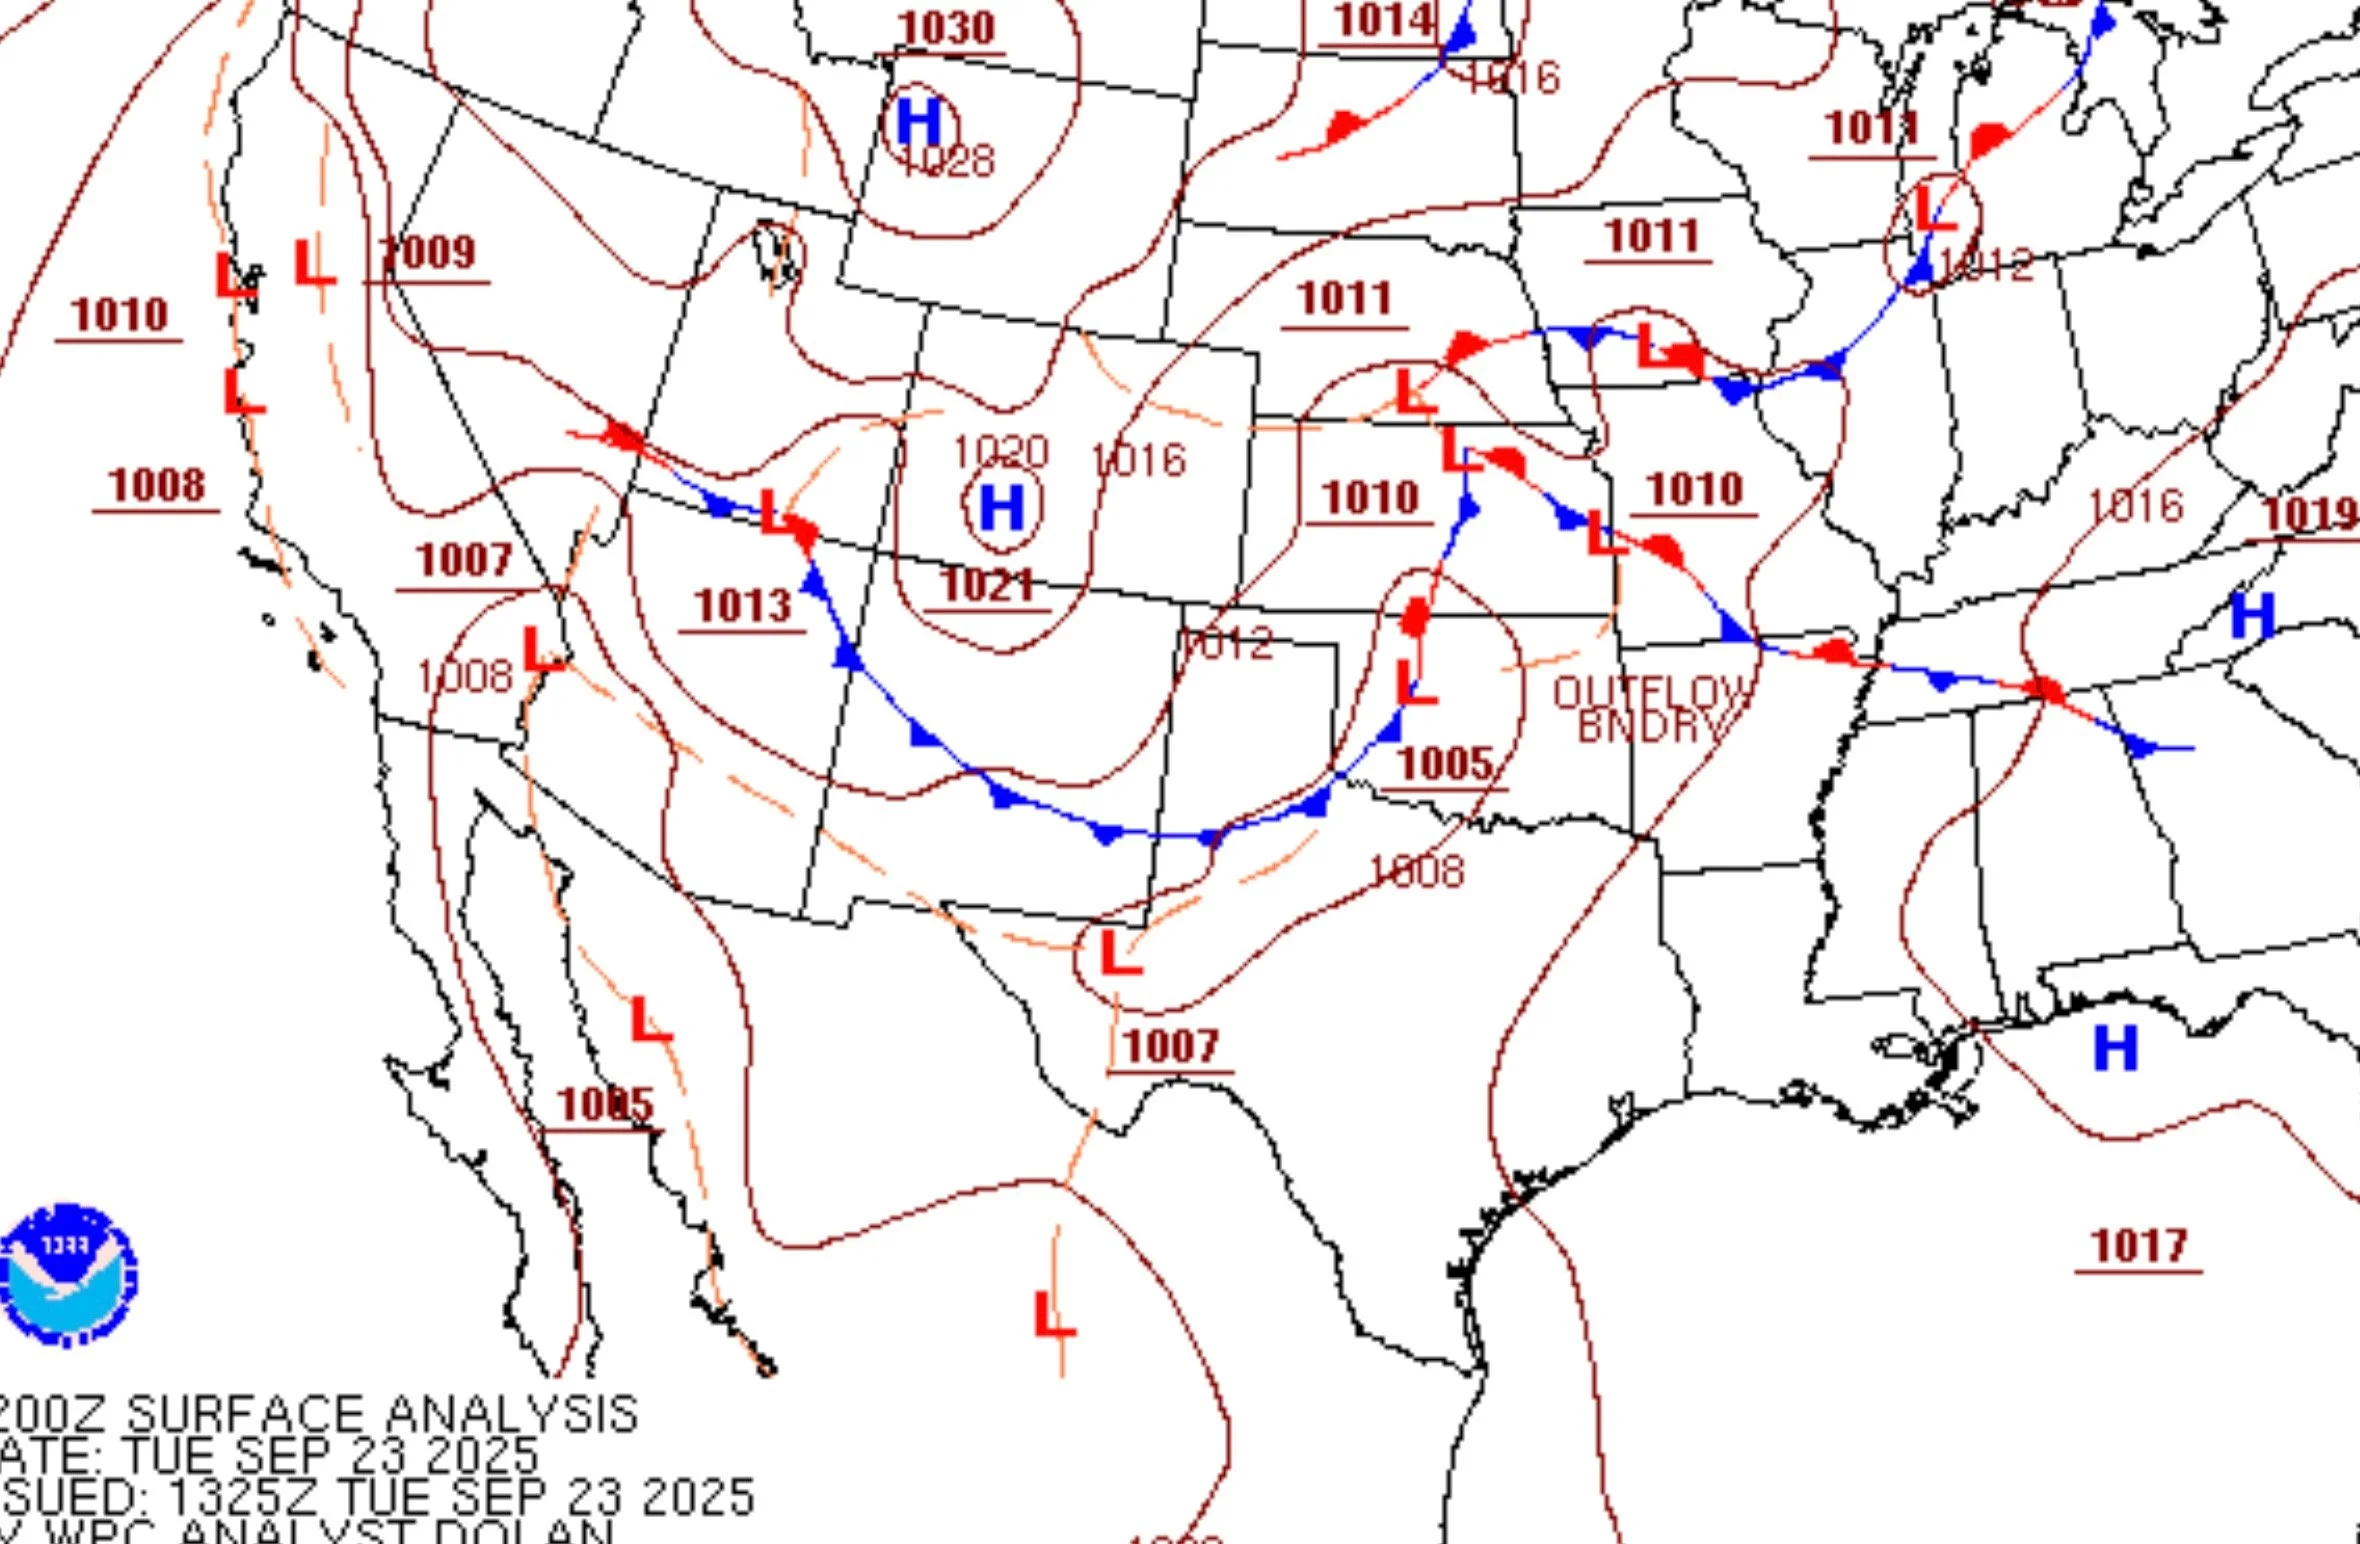
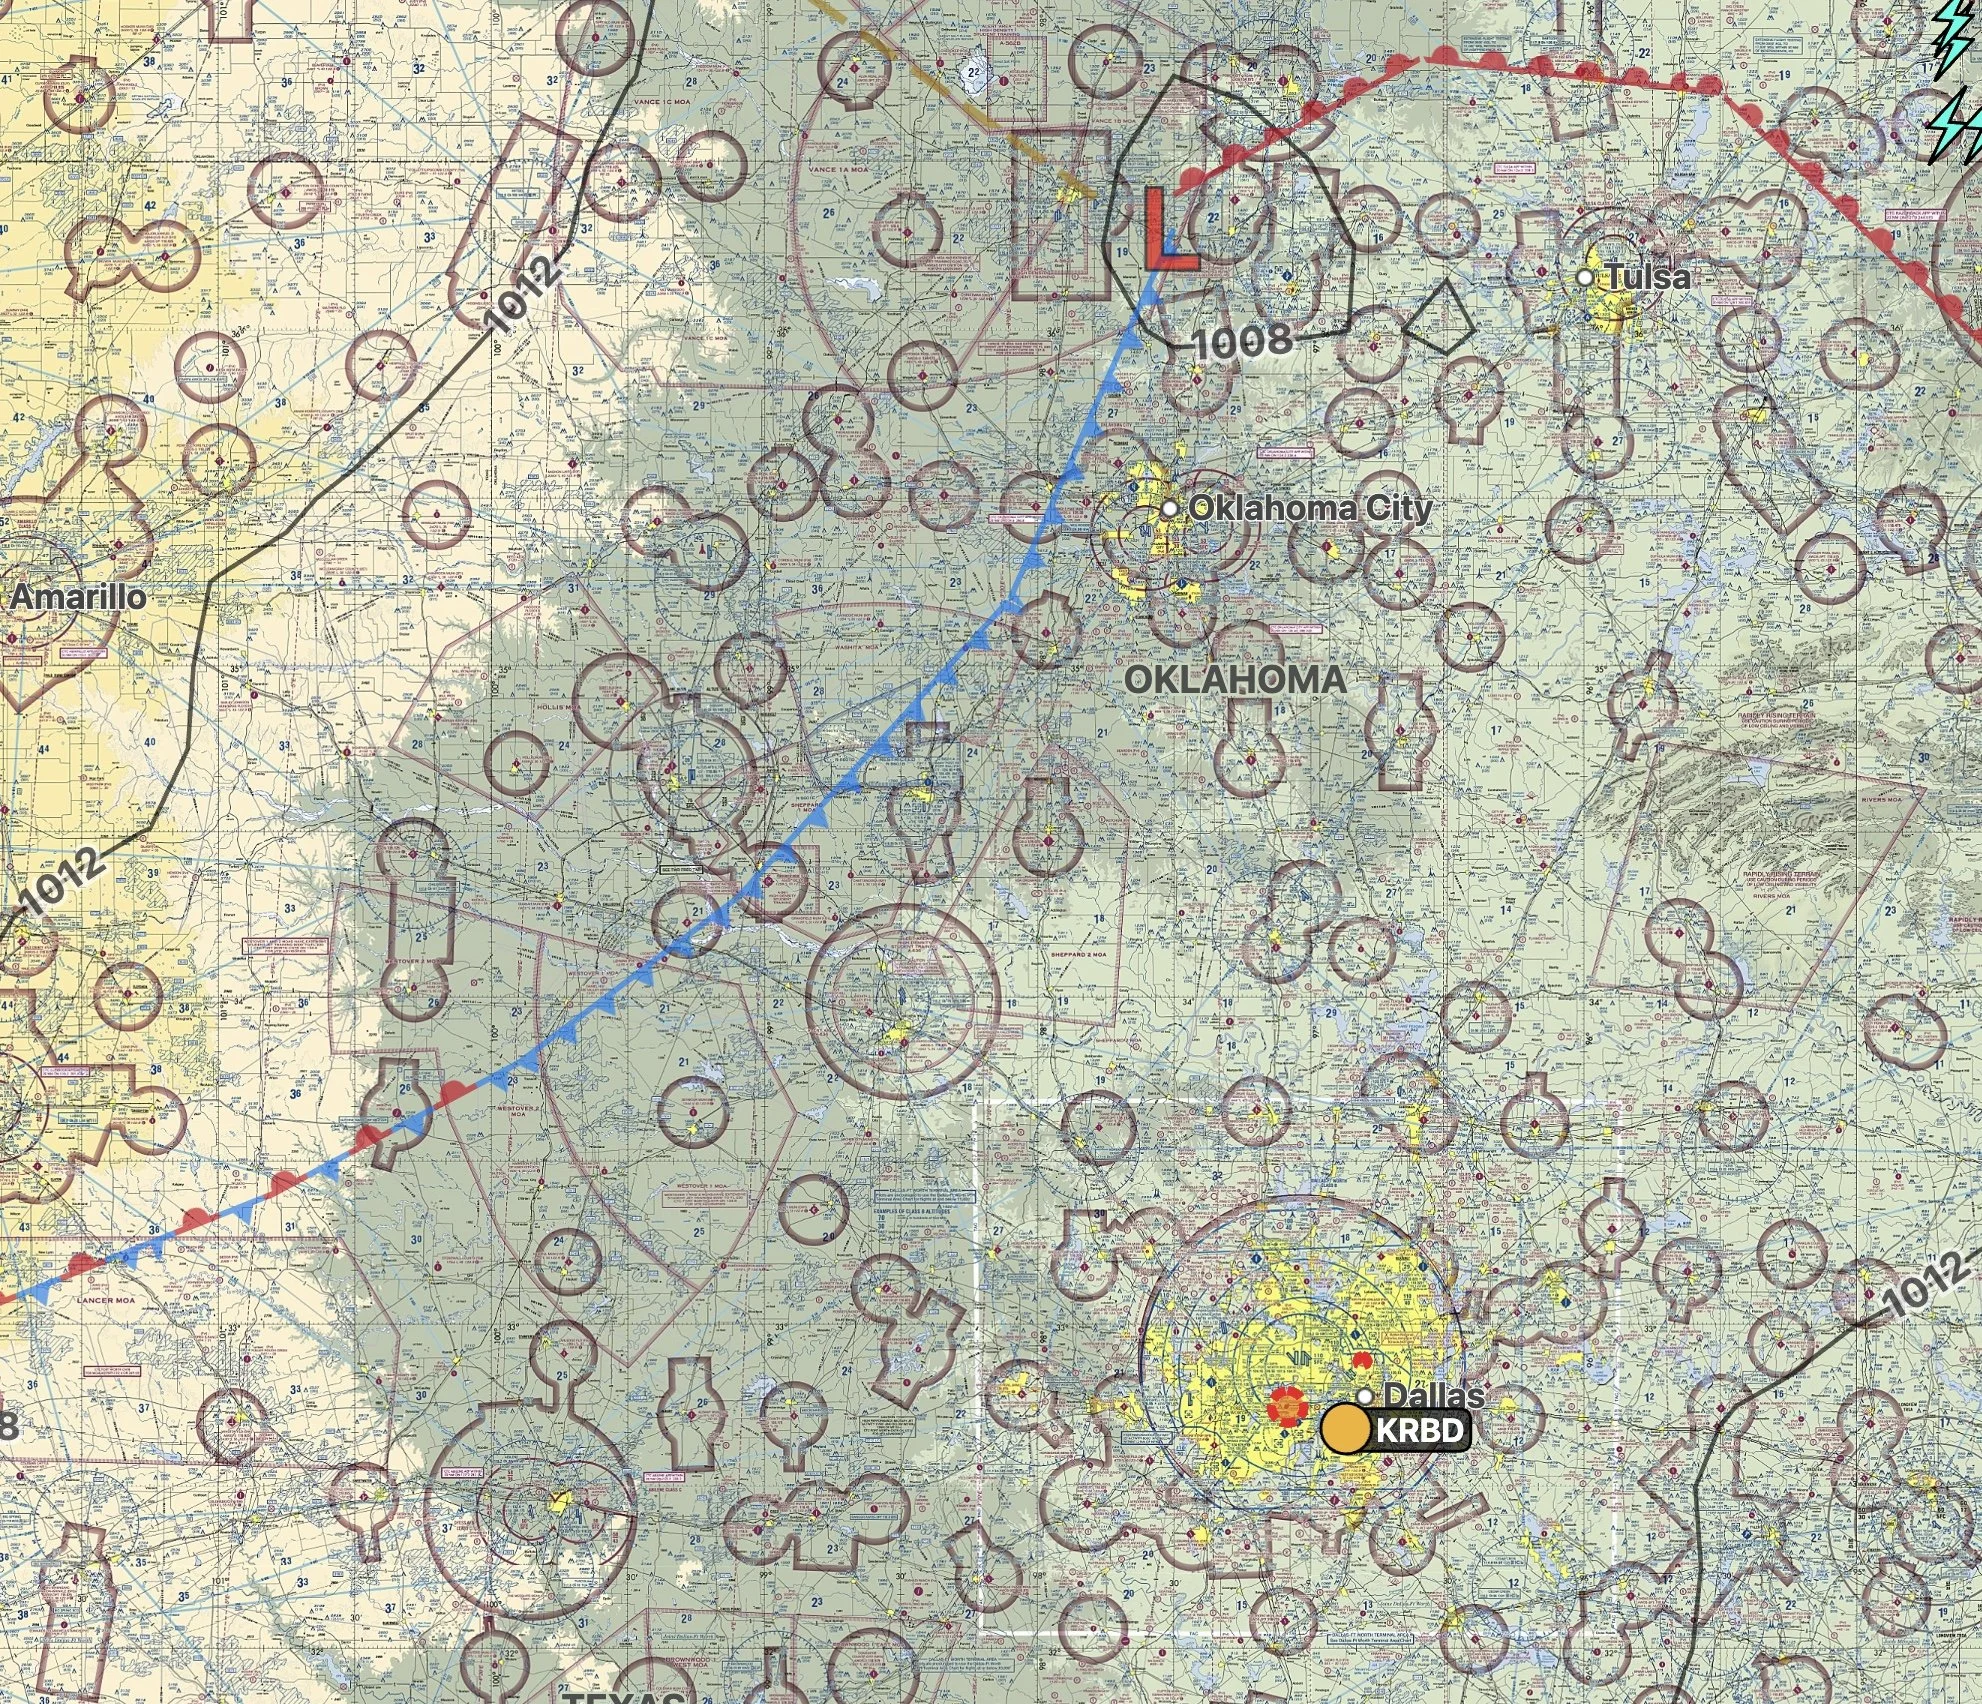
Let’s look at today’s prognostic chart for North Texas and see what we can extract.
Prognostic Chart
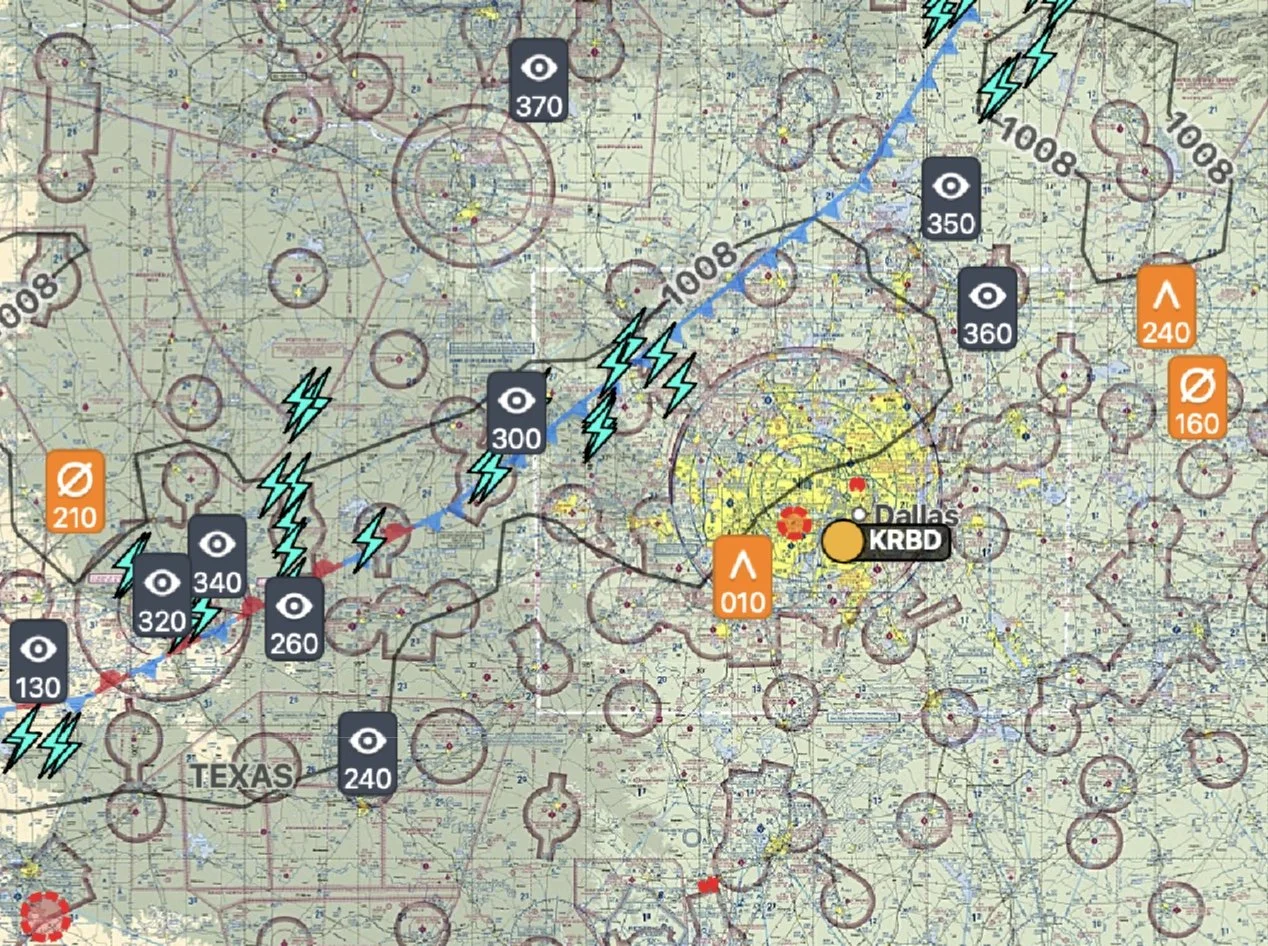
Looking at Dallas, Texas, you can see that there is an approaching cold front and dominating Low Pressure System in the region. This tells us a few things.
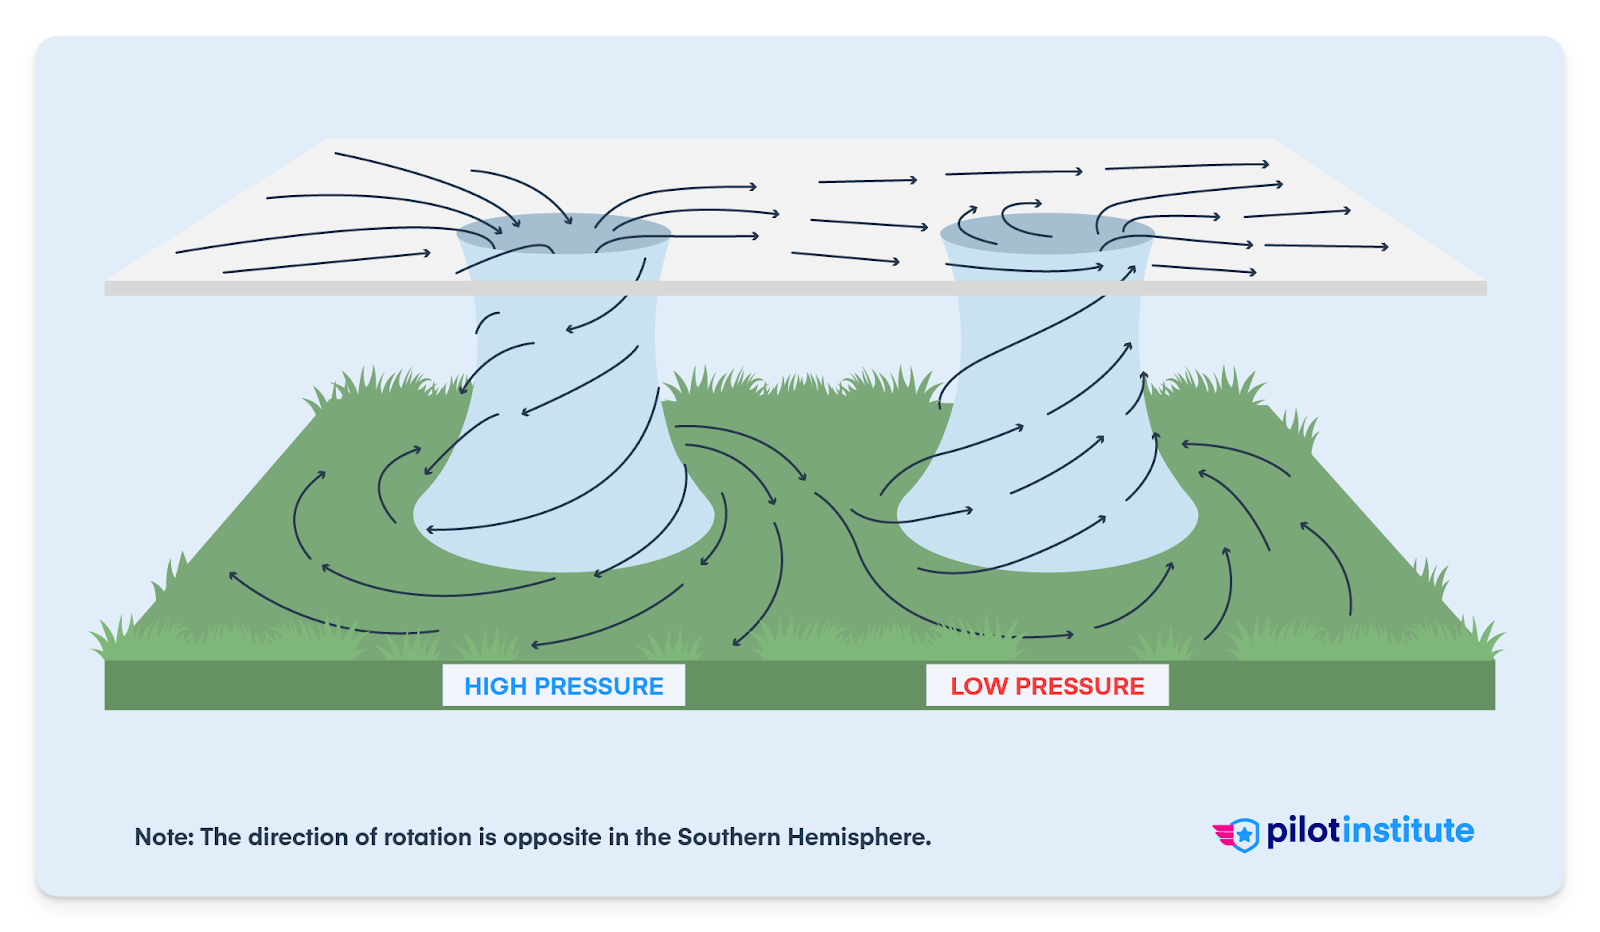
First, when a low pressure system exists, we can generally expect unstable air, clouds, and precipitation.
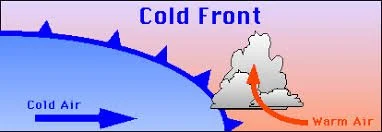
Second, when a cold front is approaching, we can expect the cold air mass to bring cooler temperatures and potentially thunderstorms.
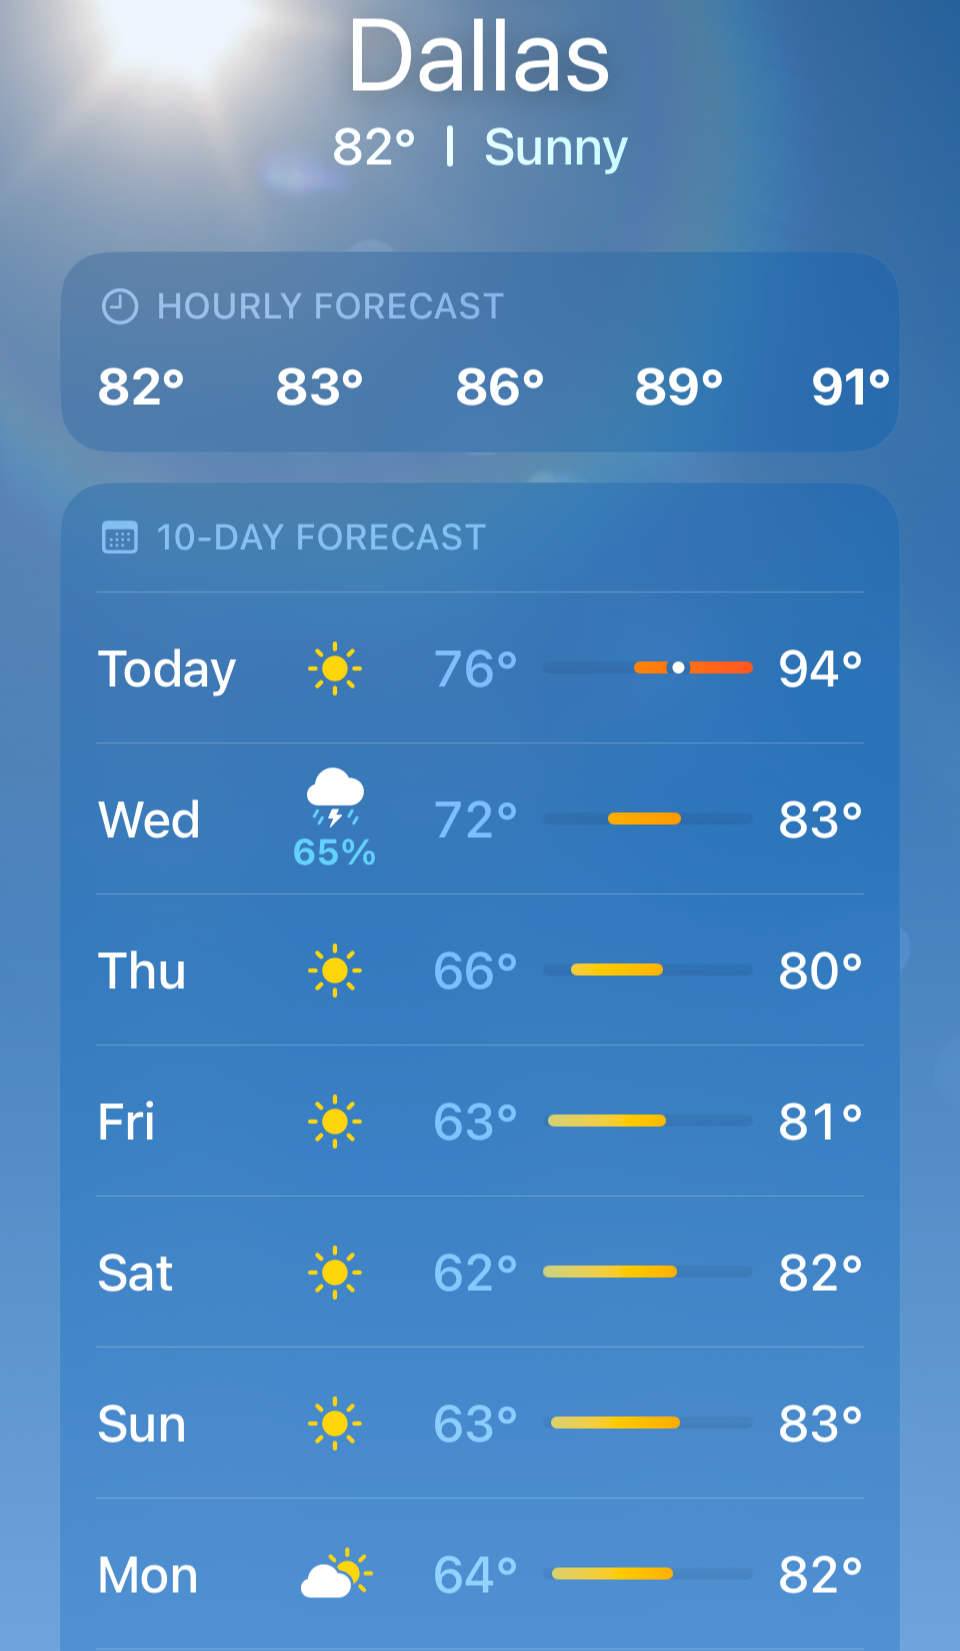
Thunderstorm and then cooler weather forecast for Dallas, TX.
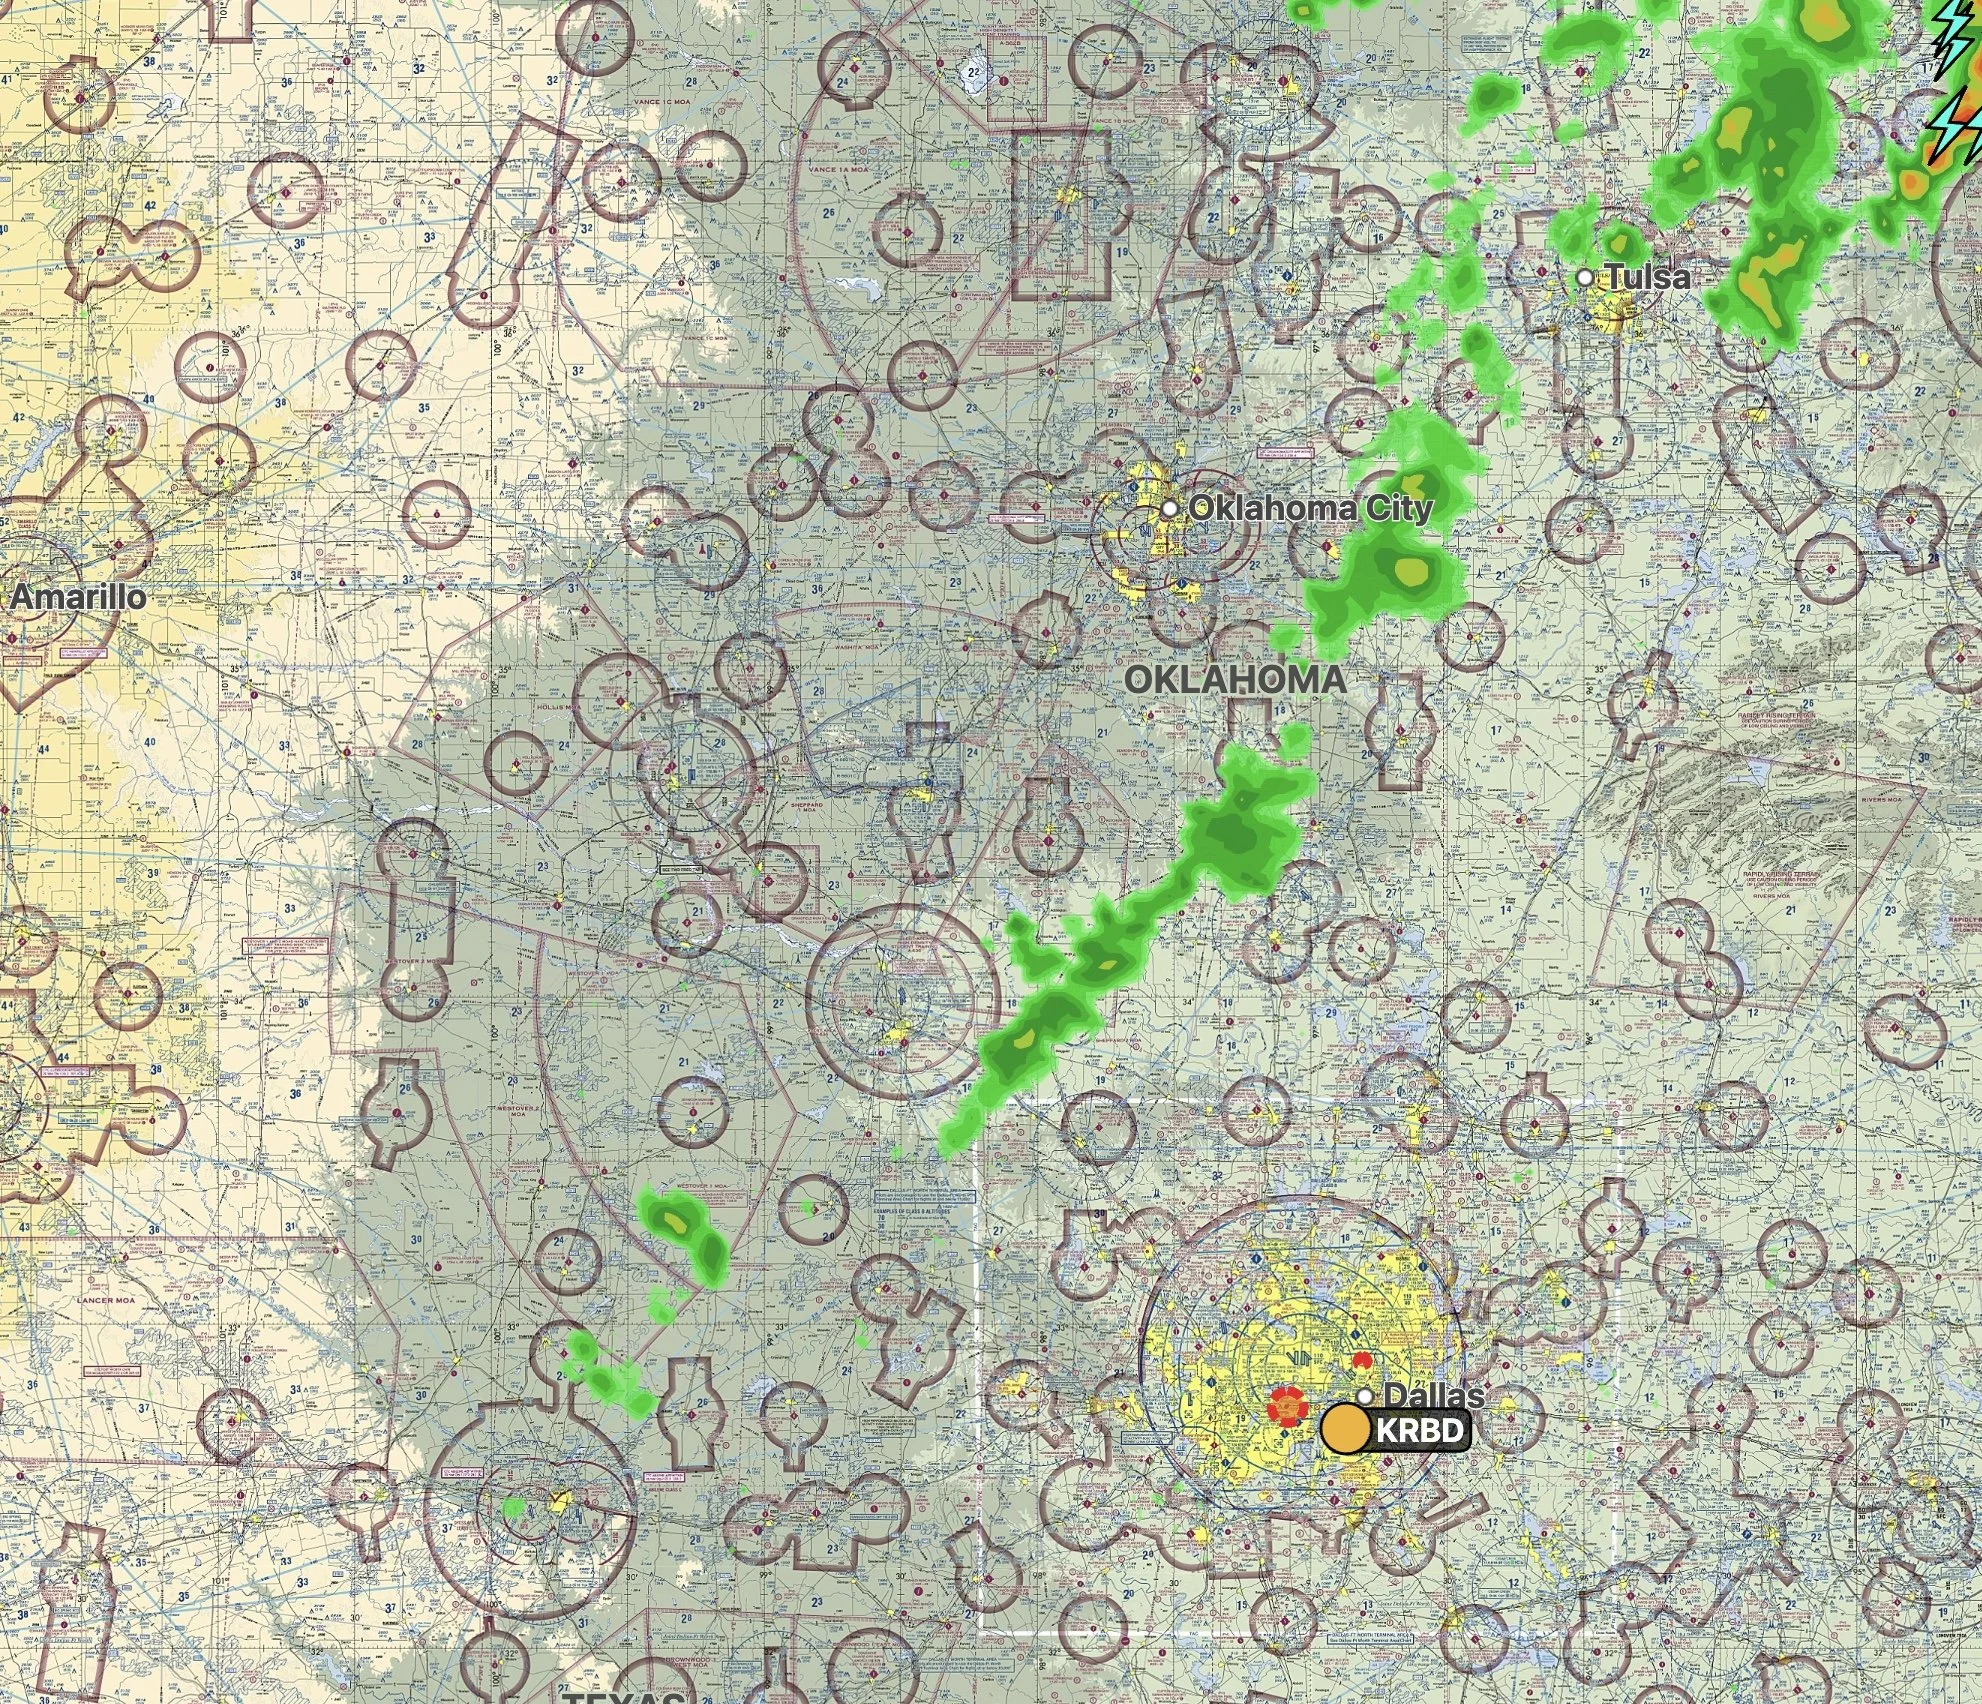
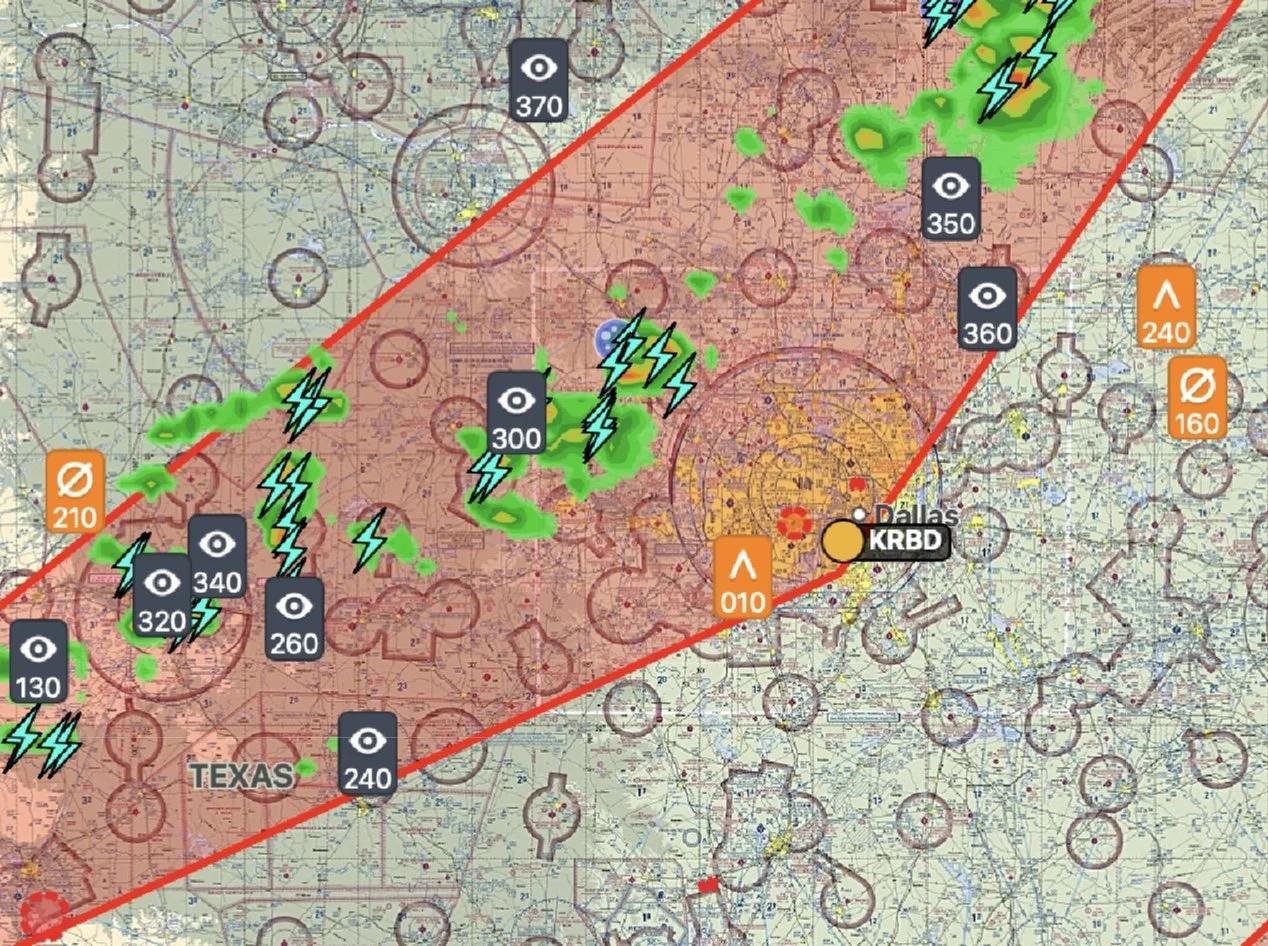
We can expect that the cold front will bring thunderstorms as it approaches over the next 24 hours. This happens because the cold front brings colder, denser air than the existing air mass, causing the existing air mass to be lifted; one of the key ingredients to thunderstorm development.
Cold front lifting existing air mass, creating vertical development.
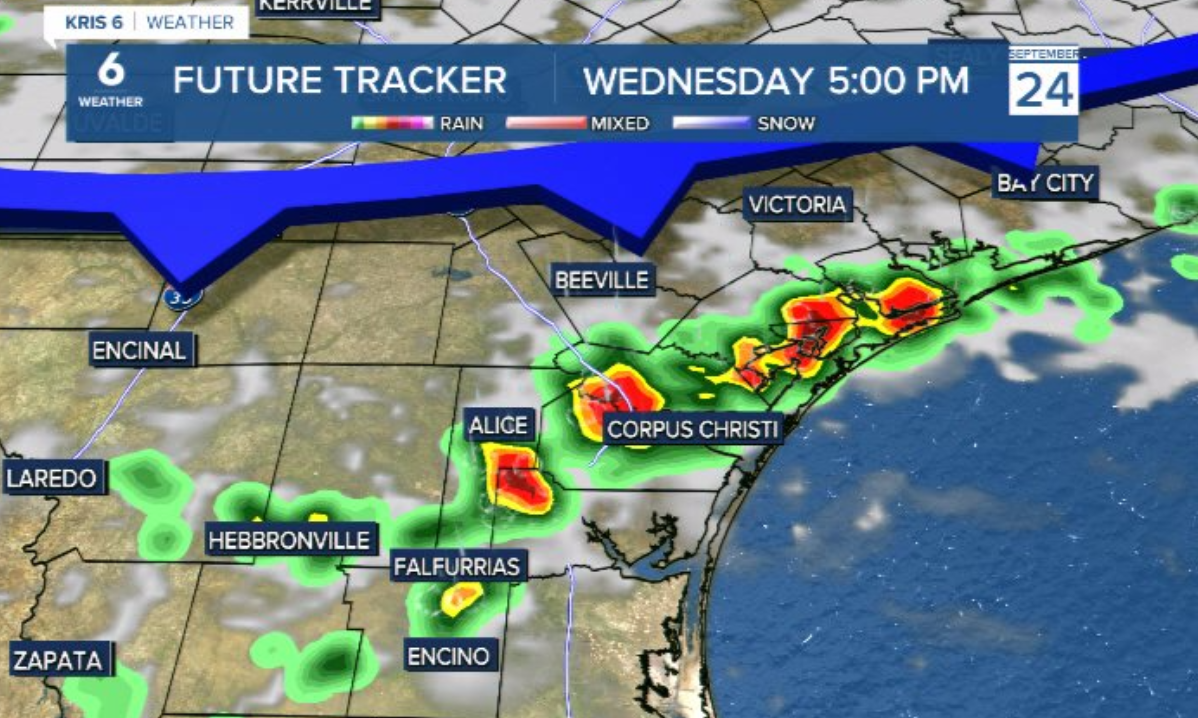
Unrelated example of a thunderstorm line preceding the arrival of a cold front.
In the pictures below, you can see the radar development in front of the cold front as the cold air mass displaces the warmer air mass vertically.
2. Is the Air Mass Stable or Unstable?
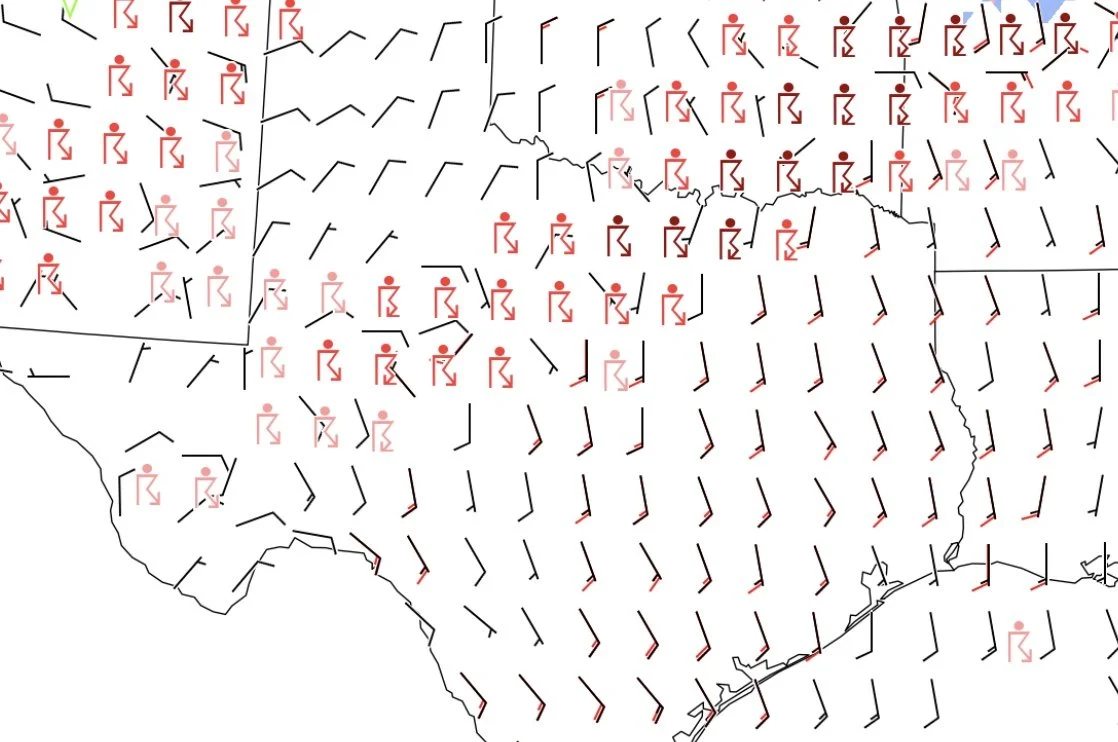
One of the best places to quickly check stability of the local air mass is the winds aloft chart.
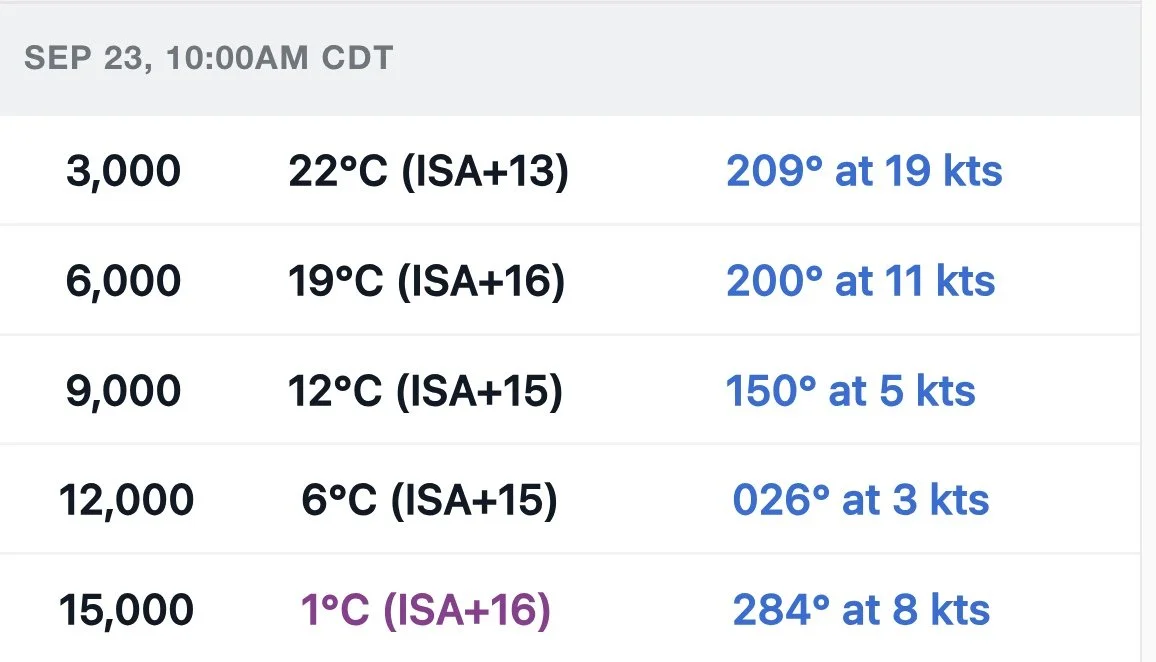
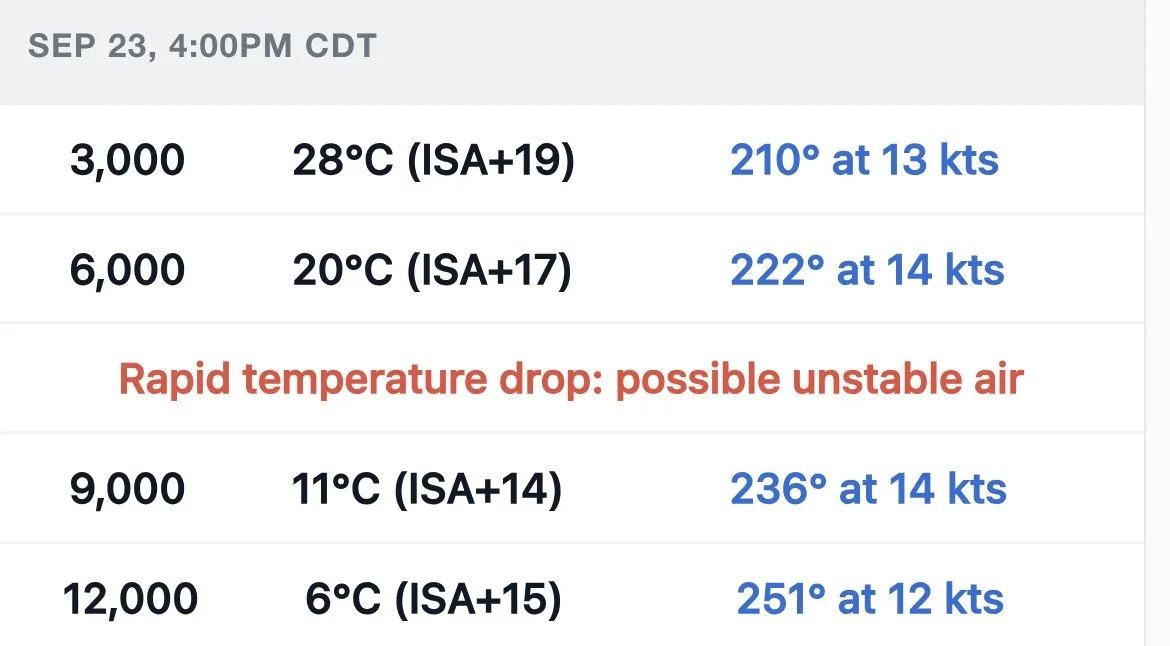
To understand stability, we must understand the term ‘lapse rate’. Lapse rate is the rate of temperature decrease as altitude rises. The standard lapse rate or ‘Dry Adiabatic Lapse Rate’ (DALR) in the atmosphere is 3°C per 1,000 ft. Anything higher than that is considered less stable than standard, and anything lower is considered more stable than standard. Stable air tends to resist resist vertical motion and leads to benign conditions(although not necessarily good conditions), and unstable air does not resist vertical motion, resulting in cumulus clouds and thunderstorms.
In the two pictures above, we can see on the left, the temperature change between 3,000 to 6,000 ft is 3°C. This means the lapse rate is 1°C per 1,000 ft. On the right we can see the forecast for 6 hours later, showing a much higher lapse rate. So the air mass this morning is extremely stable, however it is trending towards unstable as the Low Pressure System and associated Cold Front move in.
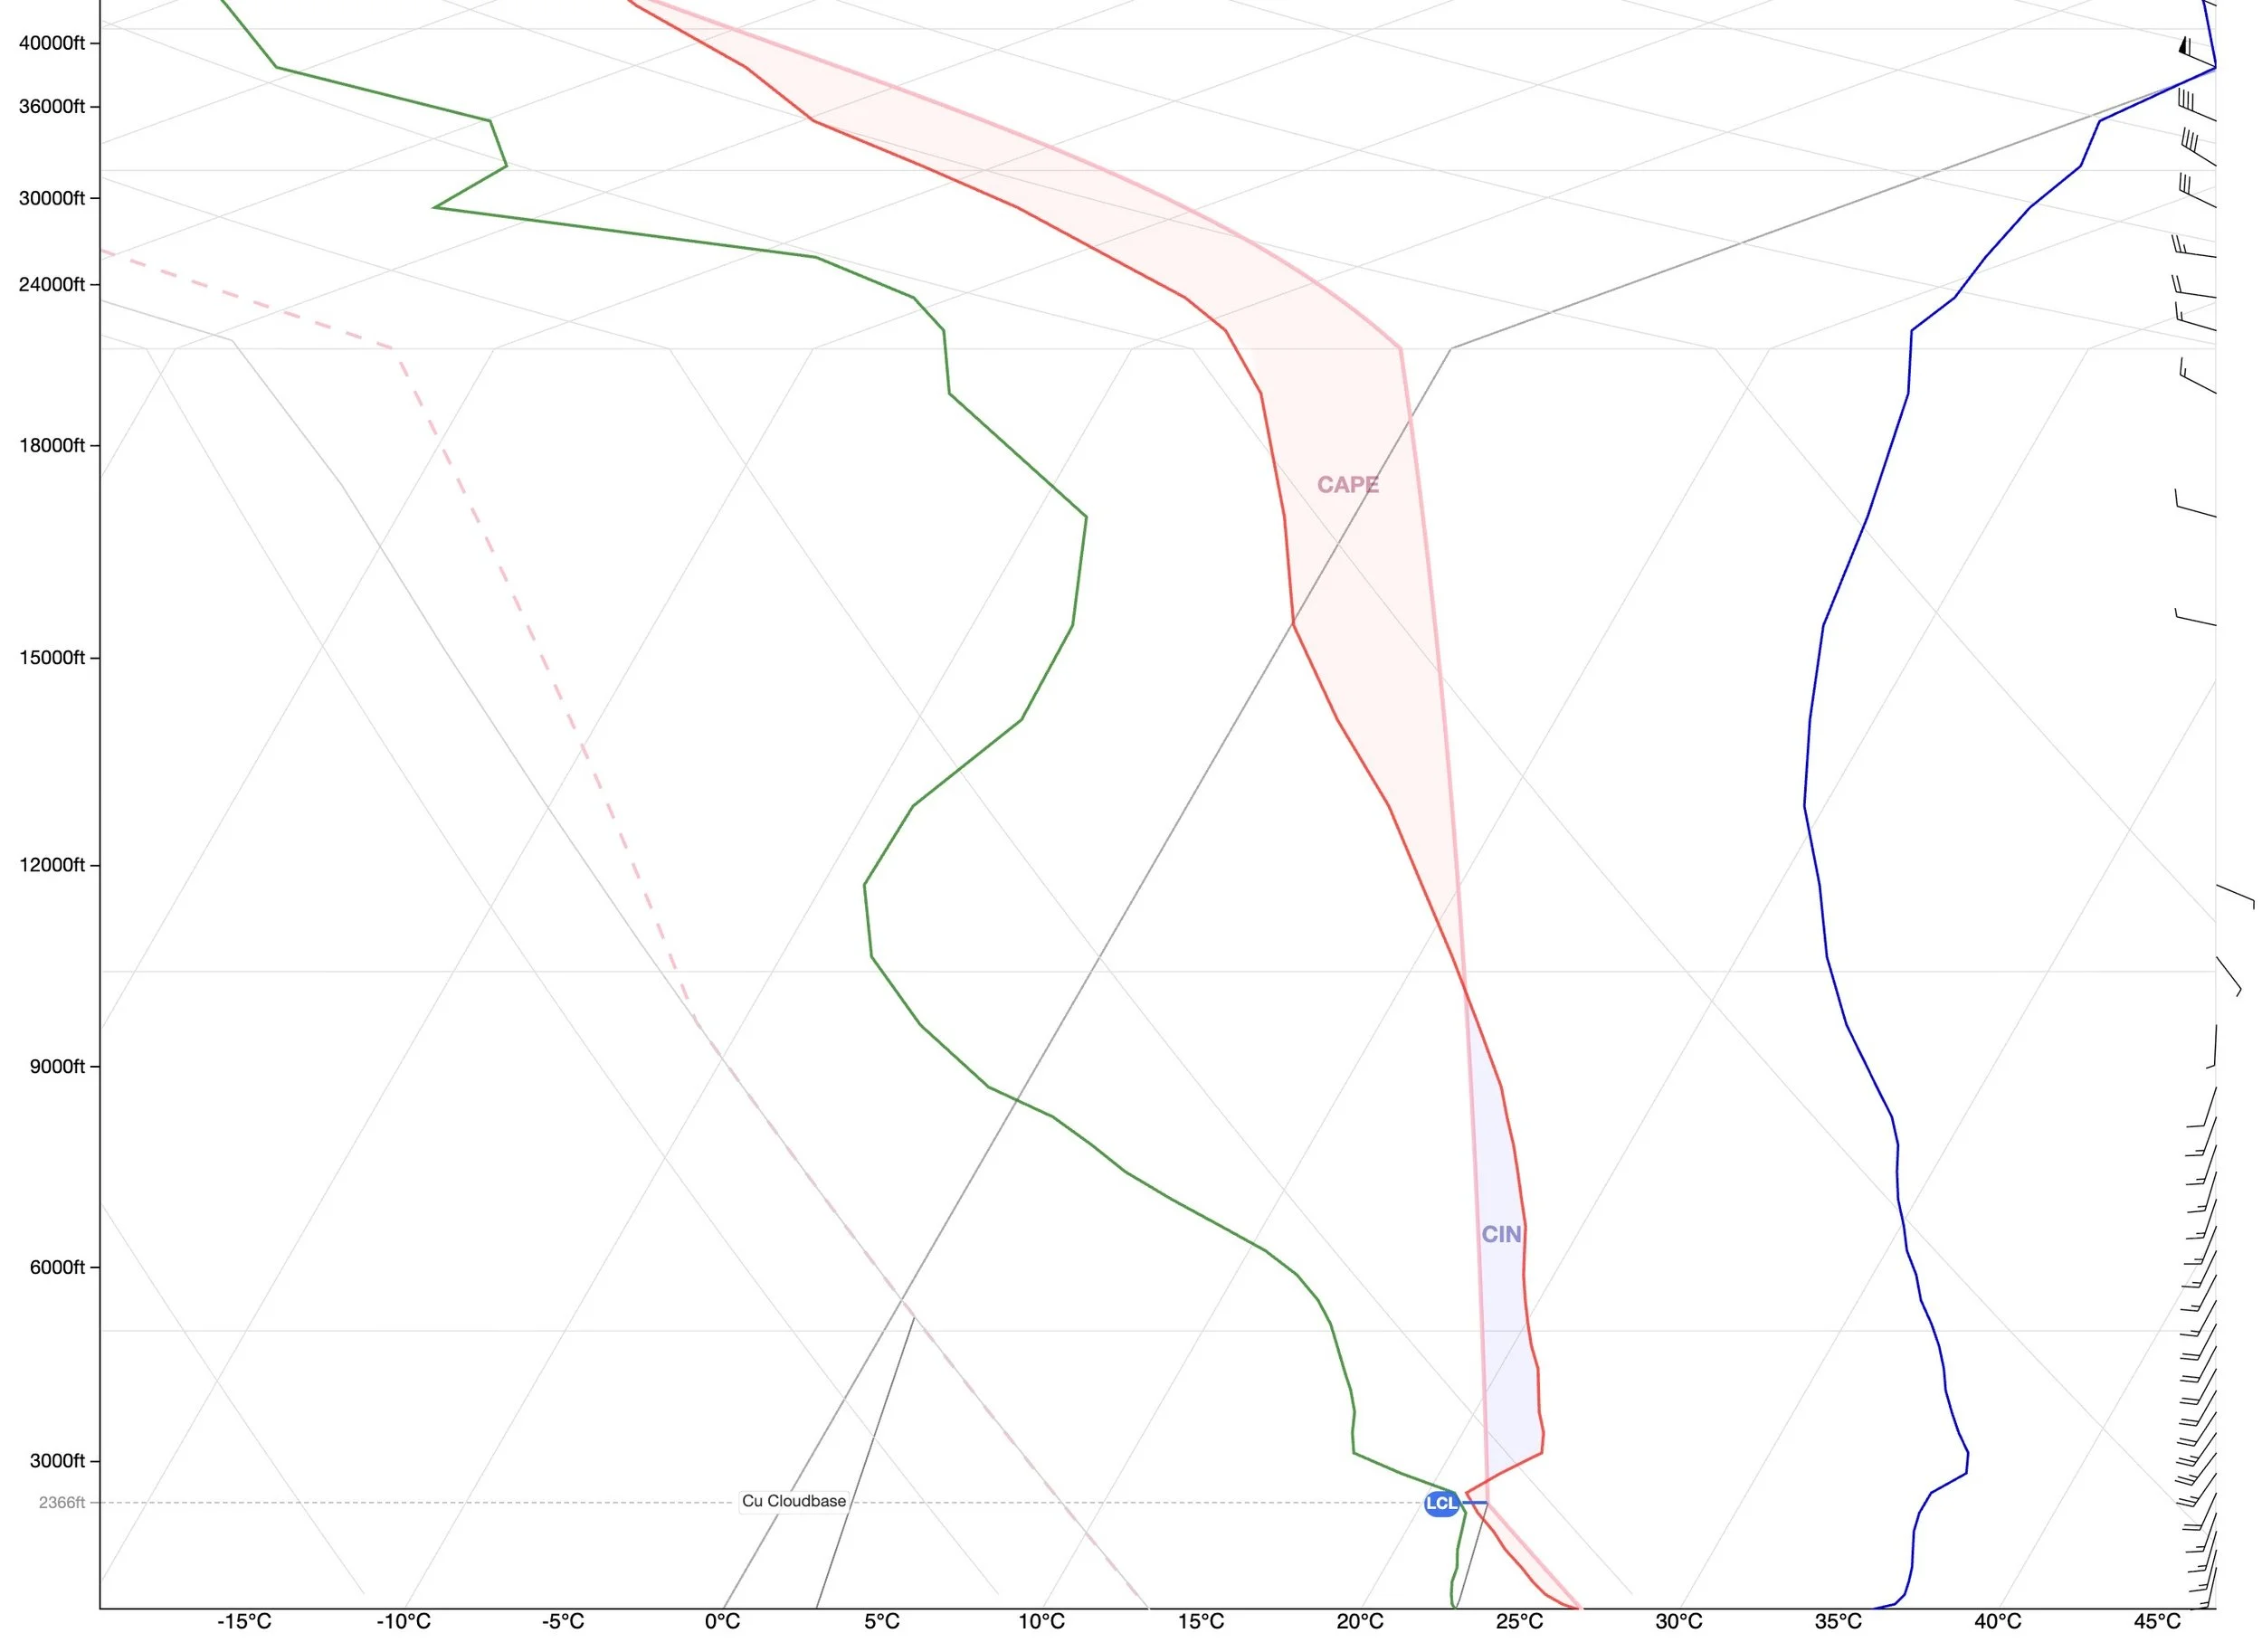
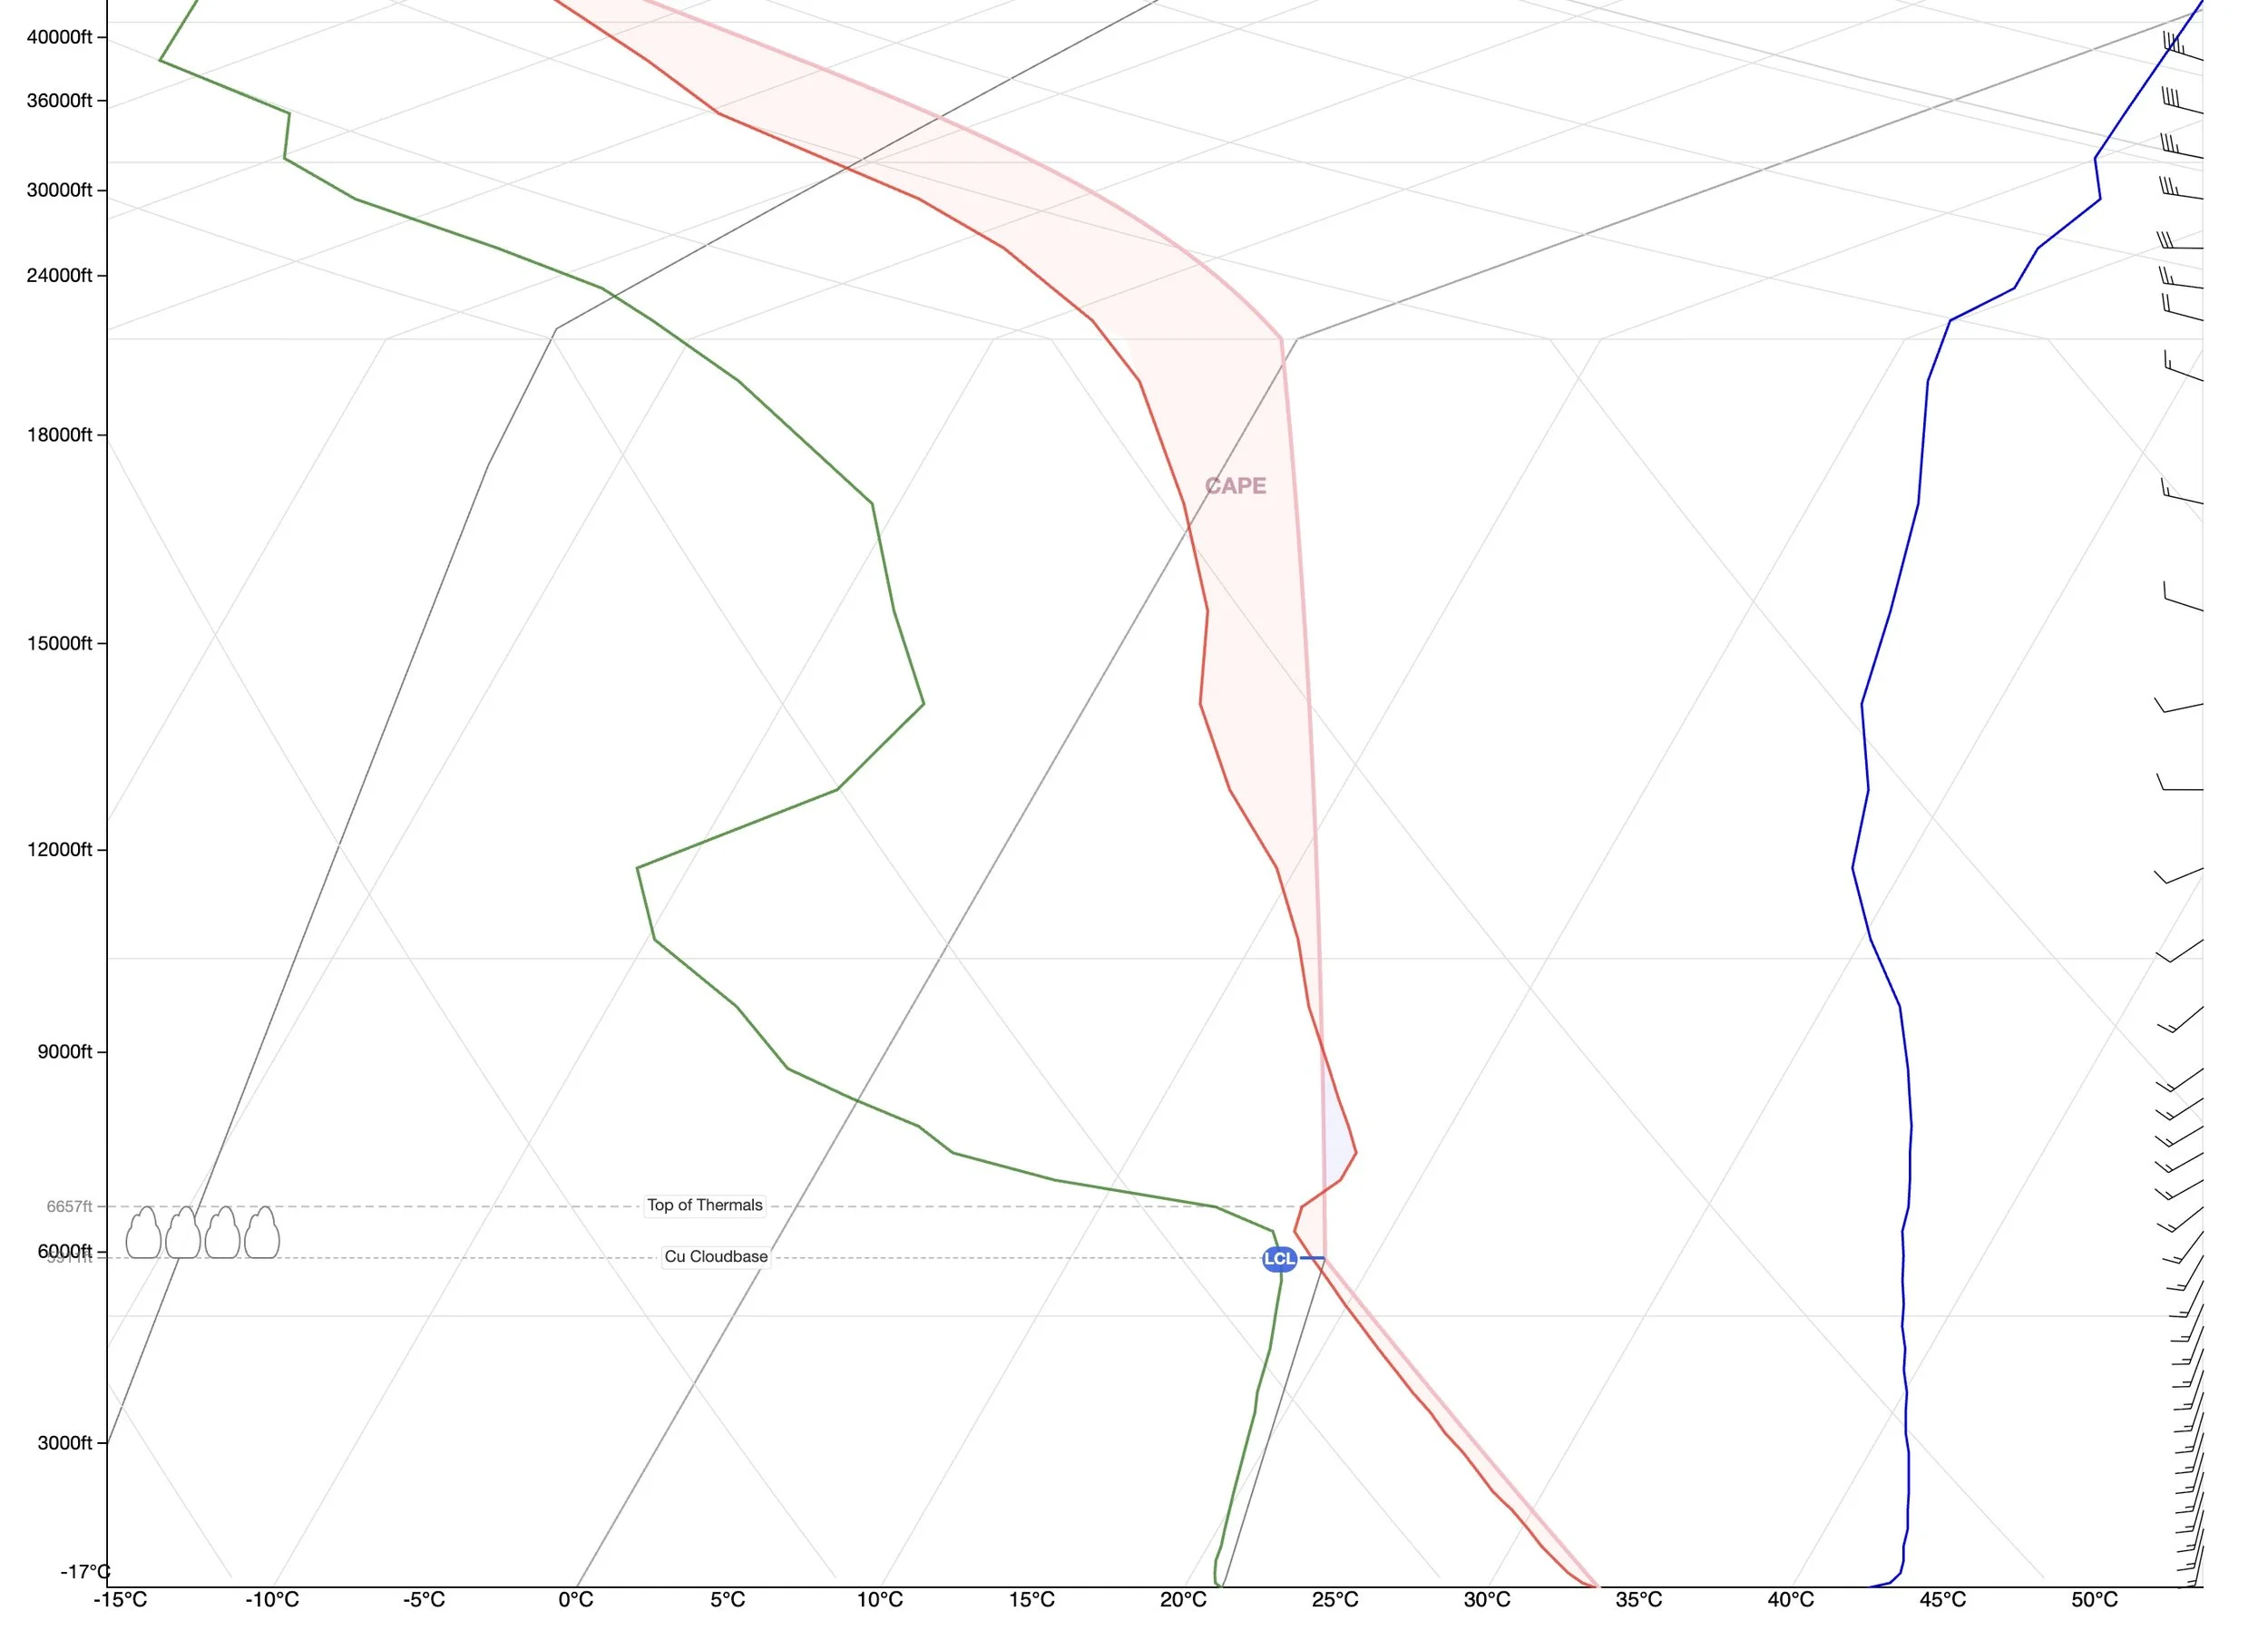
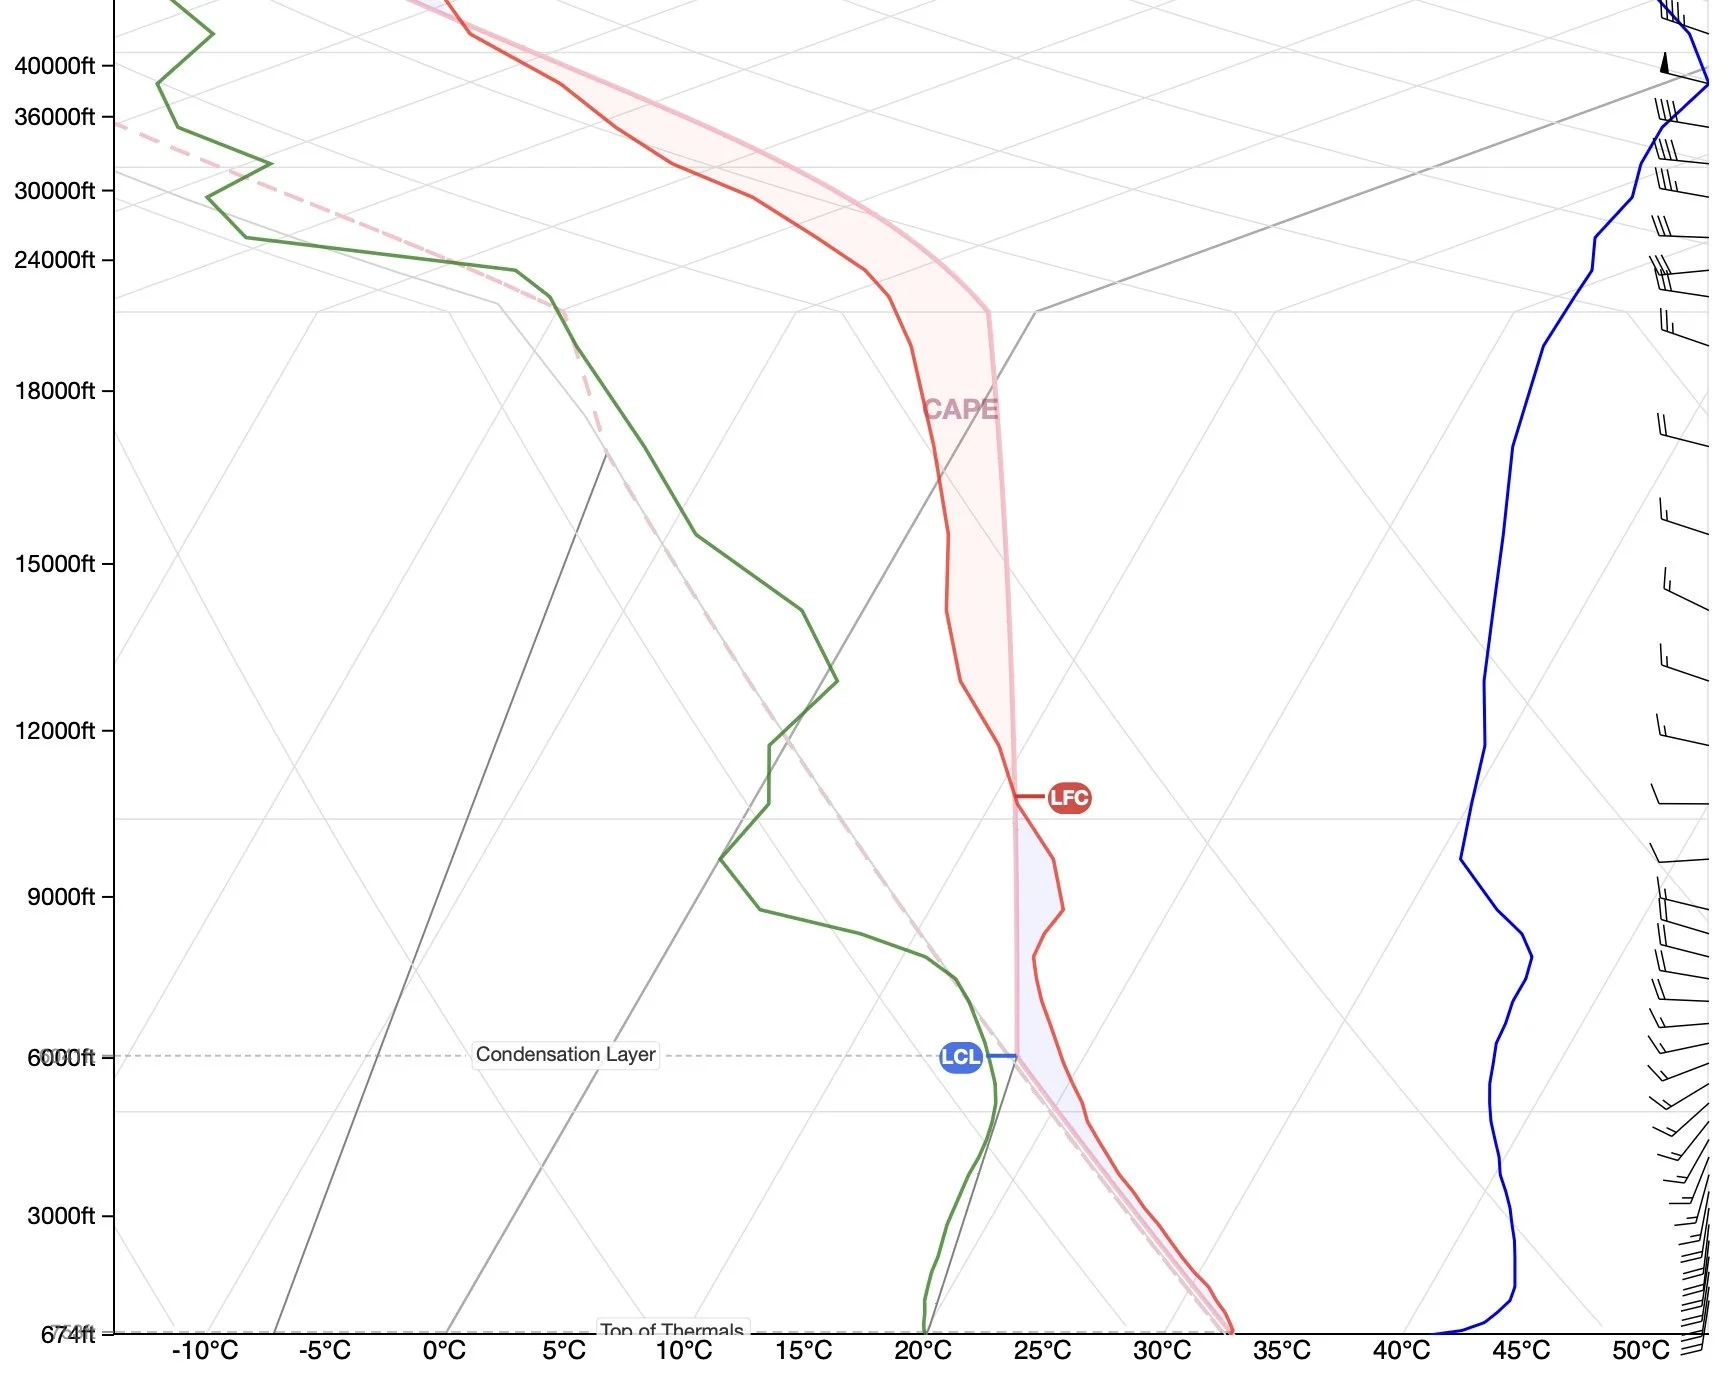
Another resource to predict the structure of an air mass is a Radiosonde Sounding which is typically depicted on a ‘Skew T Log P’ Chart. These atmospheric soundings are acquired by sending a balloon up into the atmosphere twice a day, where it collects data about temperature, dew point, and wind speed and direction.
Skew T Log P Chart
This chart gives us a vertical snapshot of the local atmosphere. Here is a quick guide to interpret this chart.
Green Line: Dew point.
Red Line: Temperature.
Blue Line: Wind speed.
Flags on the far right: Wind speed & direction.
CIN area: Stable air.
CAPE area: Unstable air.
LCL: Cloud base.
Temperature Inversion: Area where red temperature line moves to the right as it rises.
Saturated Air: Area where the temperature and dewpoint lines touch.
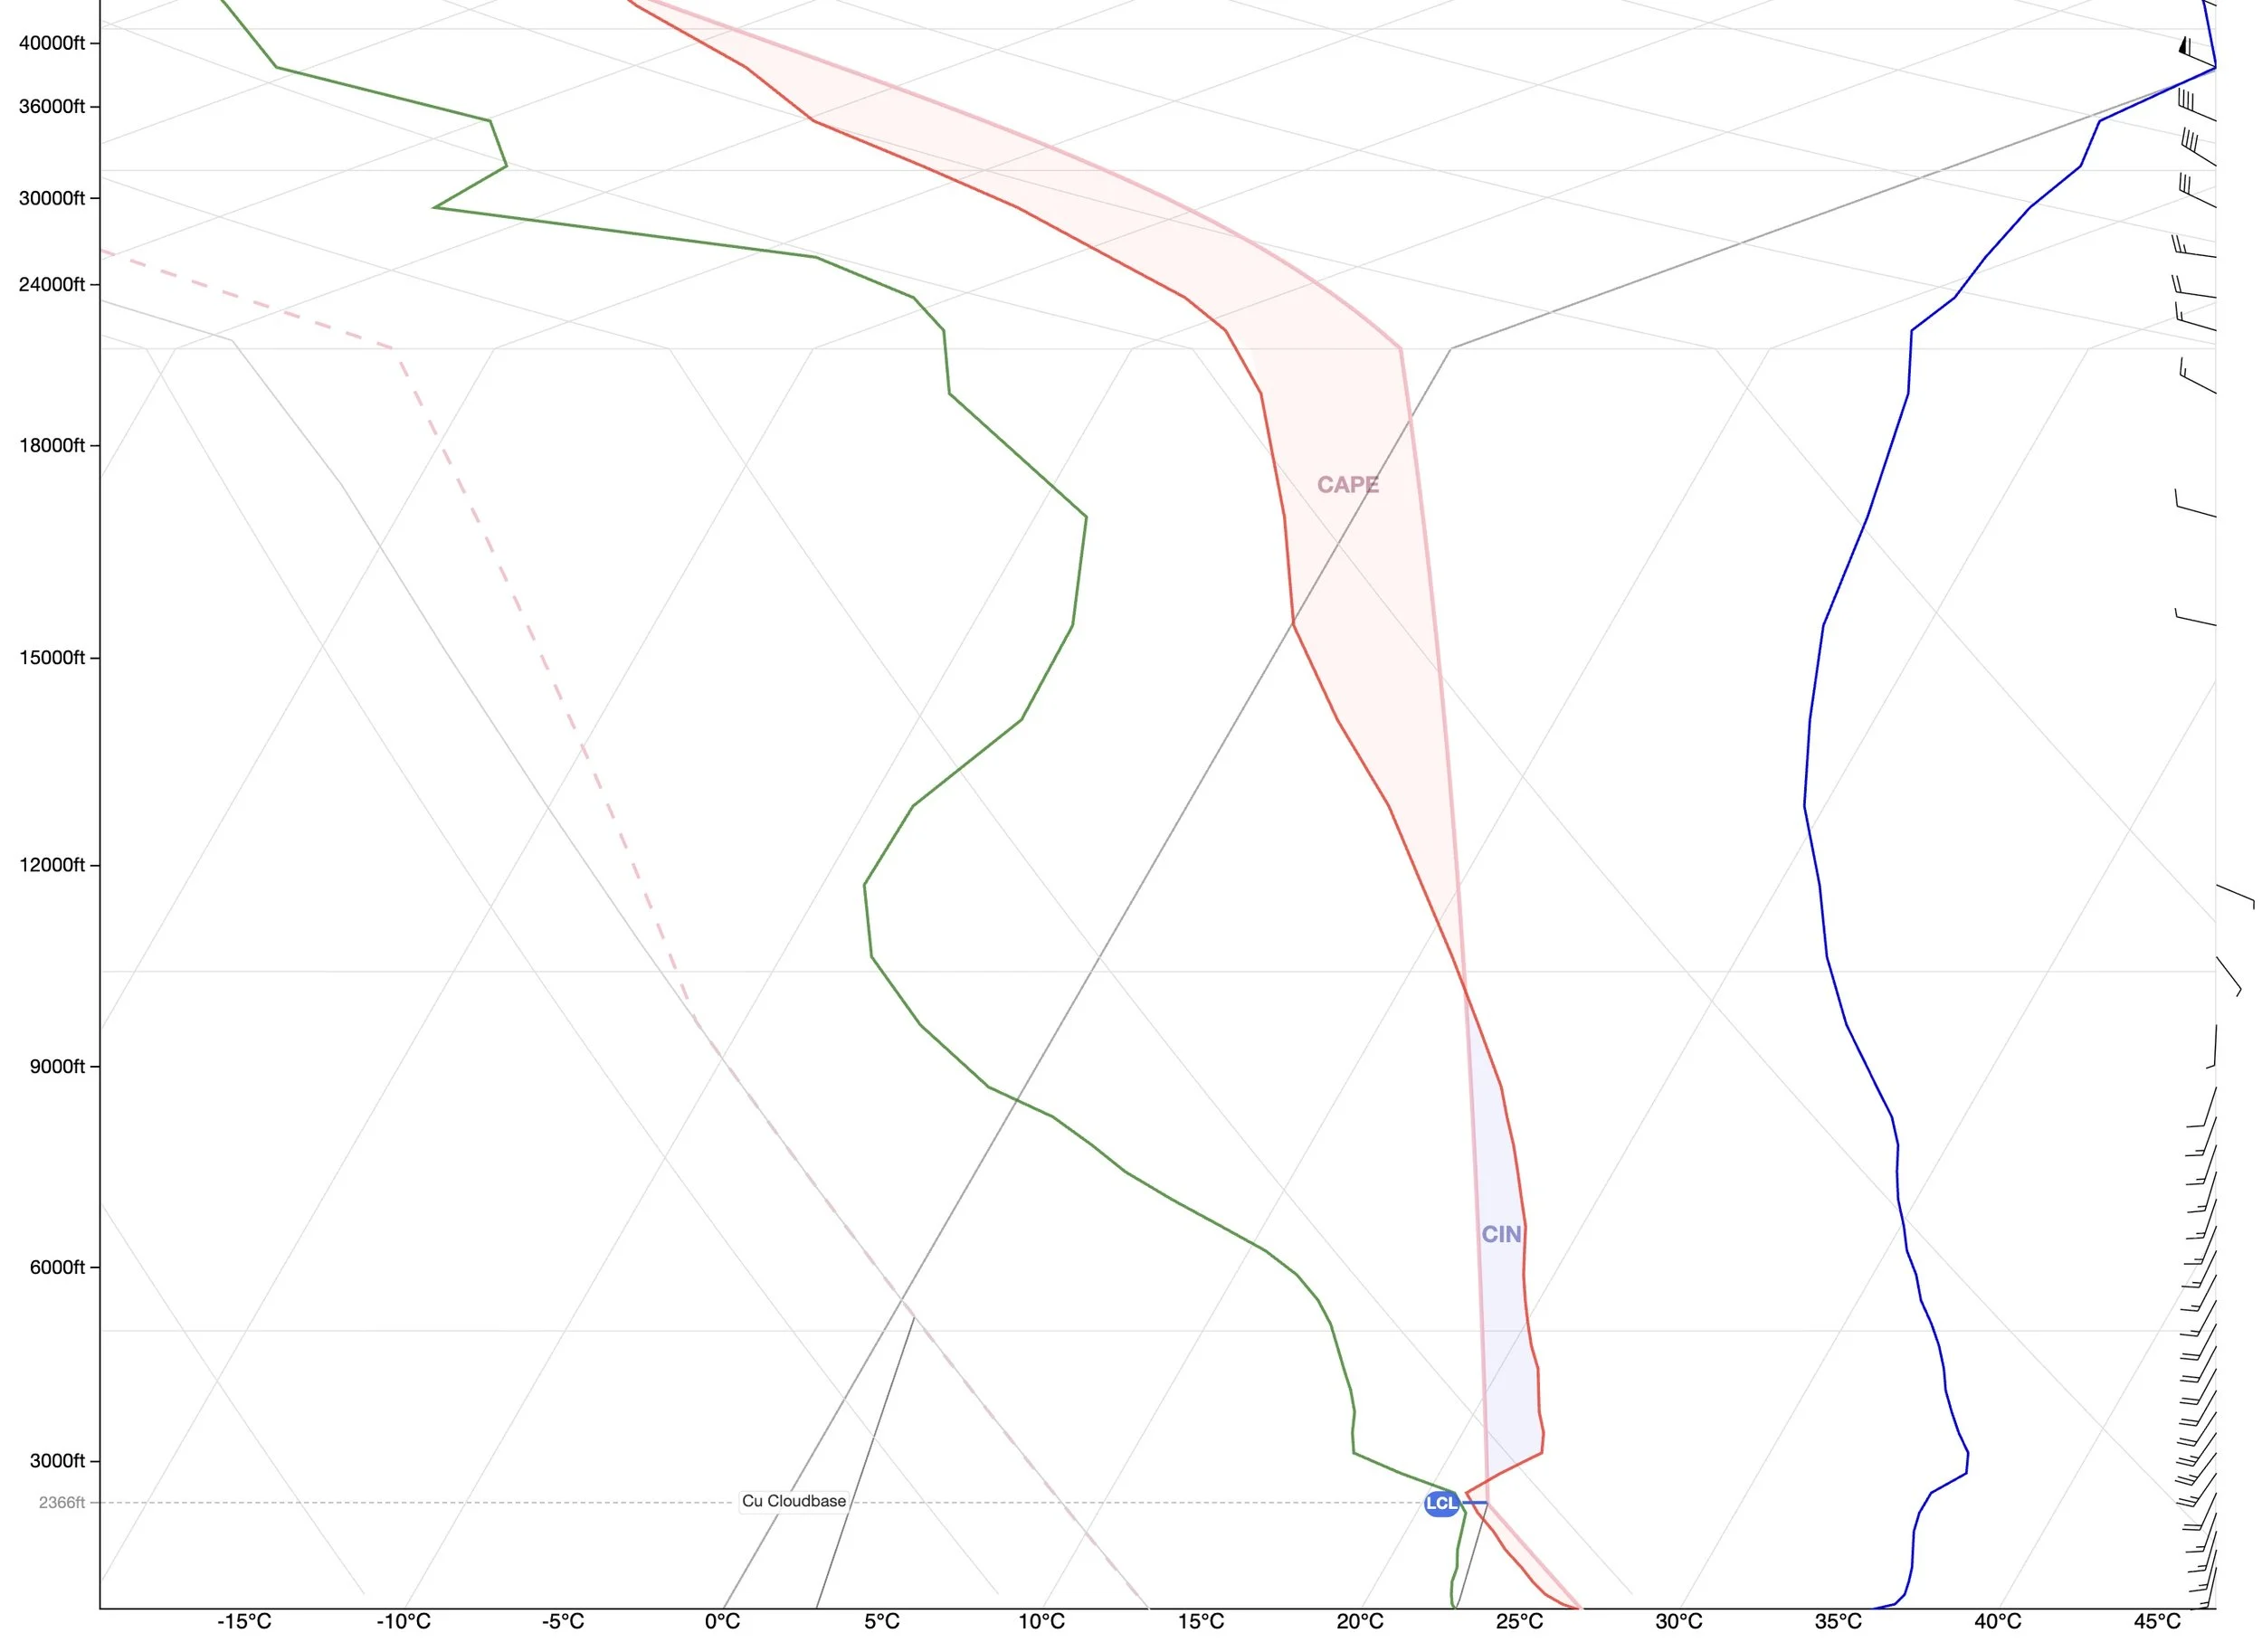
Below we can compare the forecast at 10a to 4p local time.
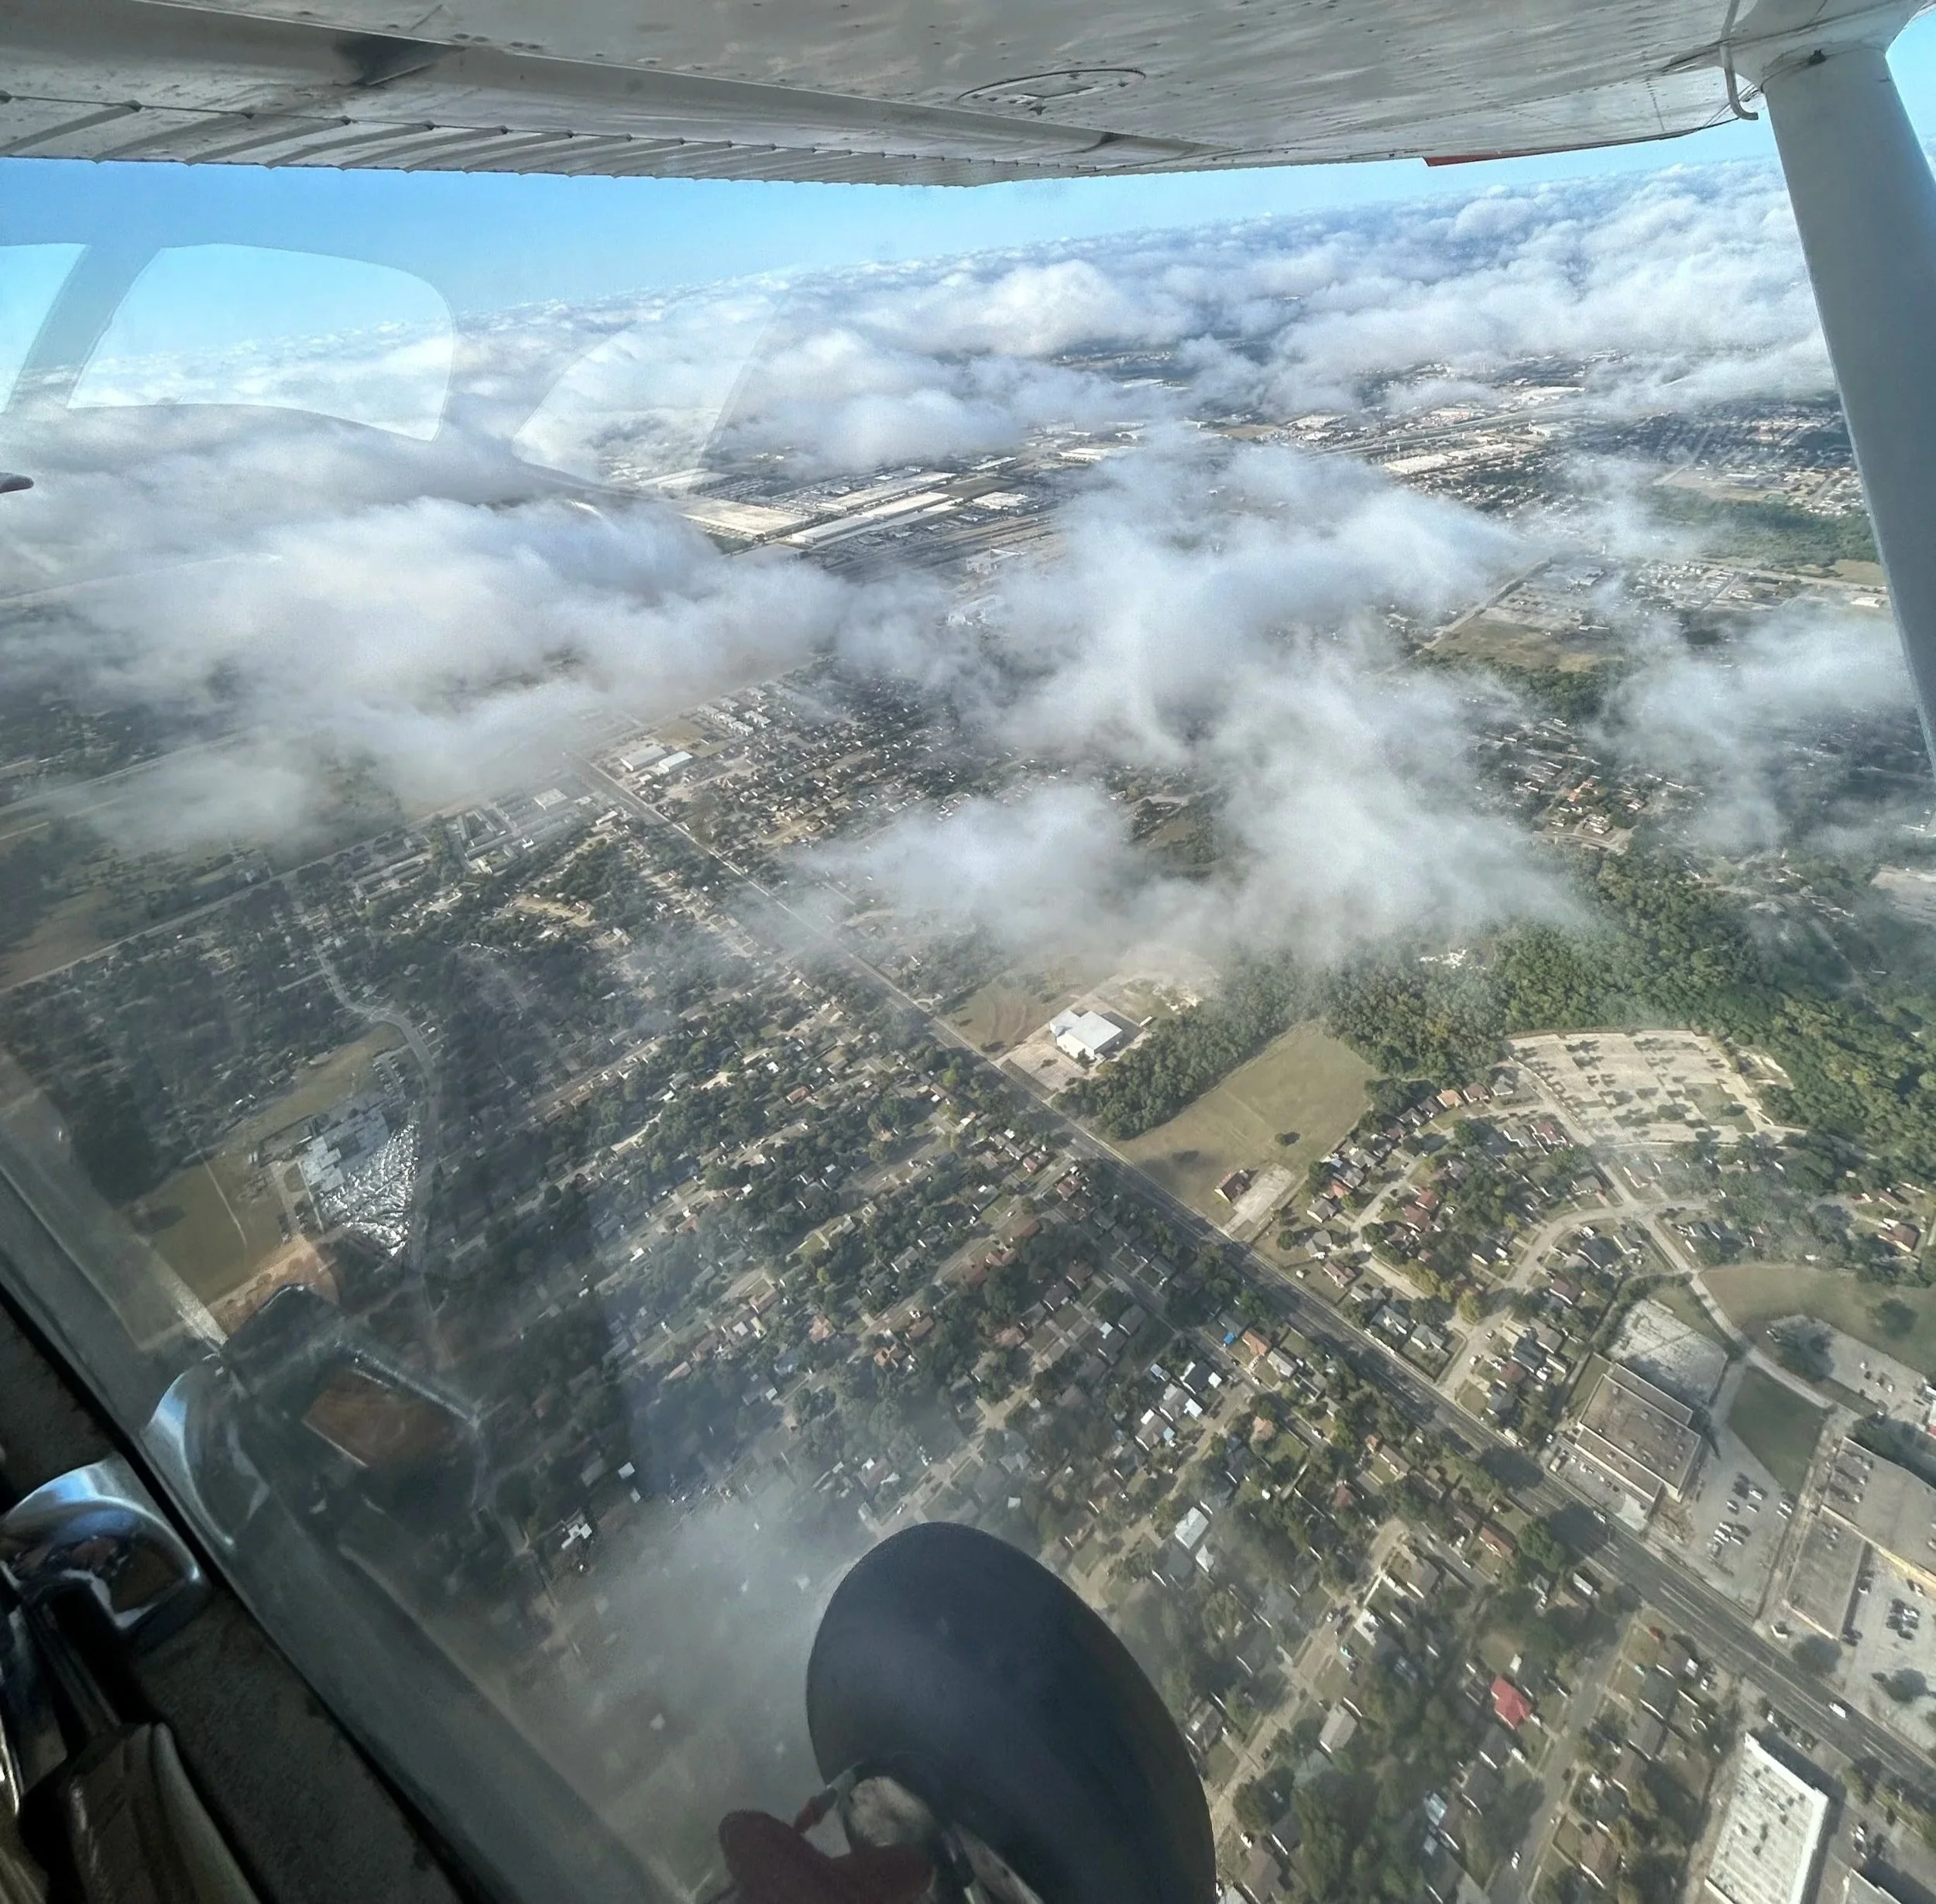
We see that the are becomes less stable over the course of the day. And also the temperature inversion rises, telling us that the low level clouds that were present this morning should rise as the day goes on.
Also, the wind shear layer that existed this morning at 3,000’ is expected to go away by the afternoon.
Morning stable cloud layer caused by inversion layer and dewpoint. Will be much higher by the afternoon as seen in the Skew T Log P Chart above.
3. Is the Air Mass Dry or Moist?
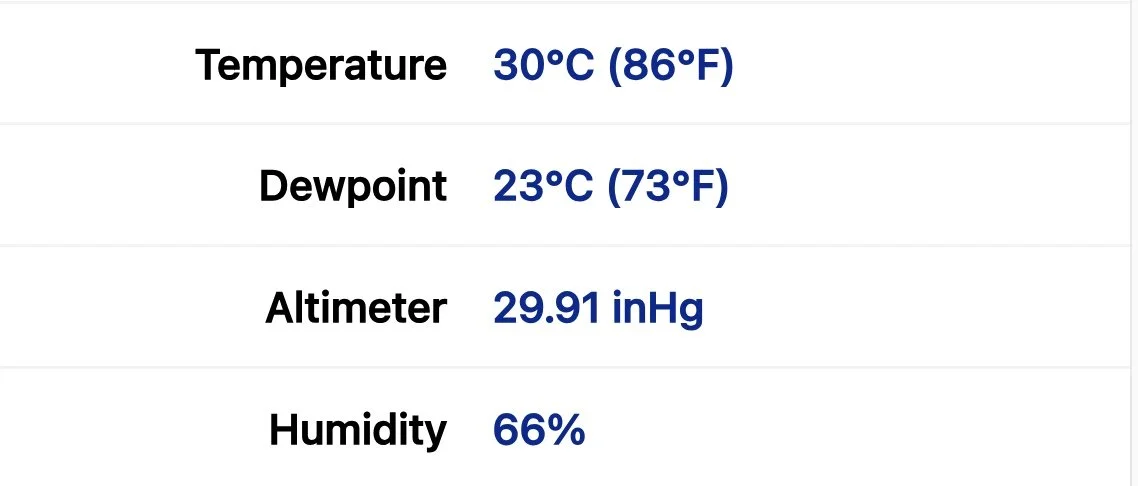
To answer this question, we need two pieces of information. We need to know the dewpoint and the relative humidity.
We can obtain the dew point today from the Skew T Chart above, it is about 23°C this morning. The relative humidity according to Foreflight’s METAR feature is 66%. So this tells us that the air is relatively moist today, which will probably be a nice recipe for thunderstorms when combined with the lifting action that the cold front will bring this evening. For now though, we should have a good day of flying until that thunderstorm line reaches the metroplex.
Dewpoint and Humidity tell us if the current air mass is dry or moist.
4. What is the Current, Local Weather?
It is a good practice to not only check the METAR at your airport, but check a few in each direction to give a good picture of what is happening in the greater local area.
Here I have selected my home airport of KRBD, as well as 3 others in each direction, and 2 more moving towards the approaching cold front to help give myself a good idea of what is happening as the front approaches.
KRBD, KJWY, KHQZ, & KGKY in the immediate area all agree on wind direction, temperature, and dewpoint, with a consistent thin layer of clouds that are barely hanging on as the sun warms the surface temperature and warms the air, causing it to be less saturated by moisture.
KDTO is on the northwest side of the metroplex and is essentially the same, giving me good feelings about a flight were I to go fly right now. I know that there is nothing immediately approaching that I need to be concerned about.
KTIK is on the current line where the radar activity is building ahead of the frontal line. You can see that there are clouds developing at 12,000’, which is likely due to the vertical development happening from the cold front pushing the existing warmer air mass upward.
Also you can see the wind direction is slightly more from the West as we move close to the approaching cold front.
5. What is the Local Forecast?
For the forecast, let’s start with the Terminal Aerodrome Forecast (TAF) for KAFW, KDFW, & and KDAL, we are lucky enough to have multiple TAF’s in the local area.
These TAF’s are mostly identical, all agreeing that we will have good weather until the thunderstorms arrive with the cold front around 0300Z which is 10p local time. We should have a good, full day of flying. But as the day goes on, pilots should be cautious and keep an eye on the thunderstorm development and radar summary to ensure things don’t develop faster than expected.
6. Are There Any Significant Threats?
By this point, we have pretty well identified the impending threat to today’s flying. Thunderstorms are on the way, but not arriving till this evening.
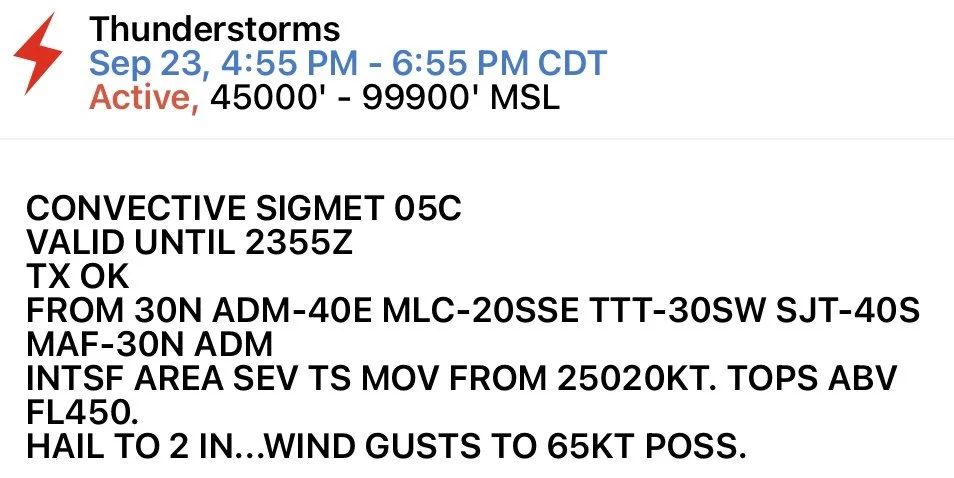
You will want to also check TFR’s, NOTAM’s, Sigmet’s, Airmet’s, and PIREP’s.
7. Does the Sky Agree?
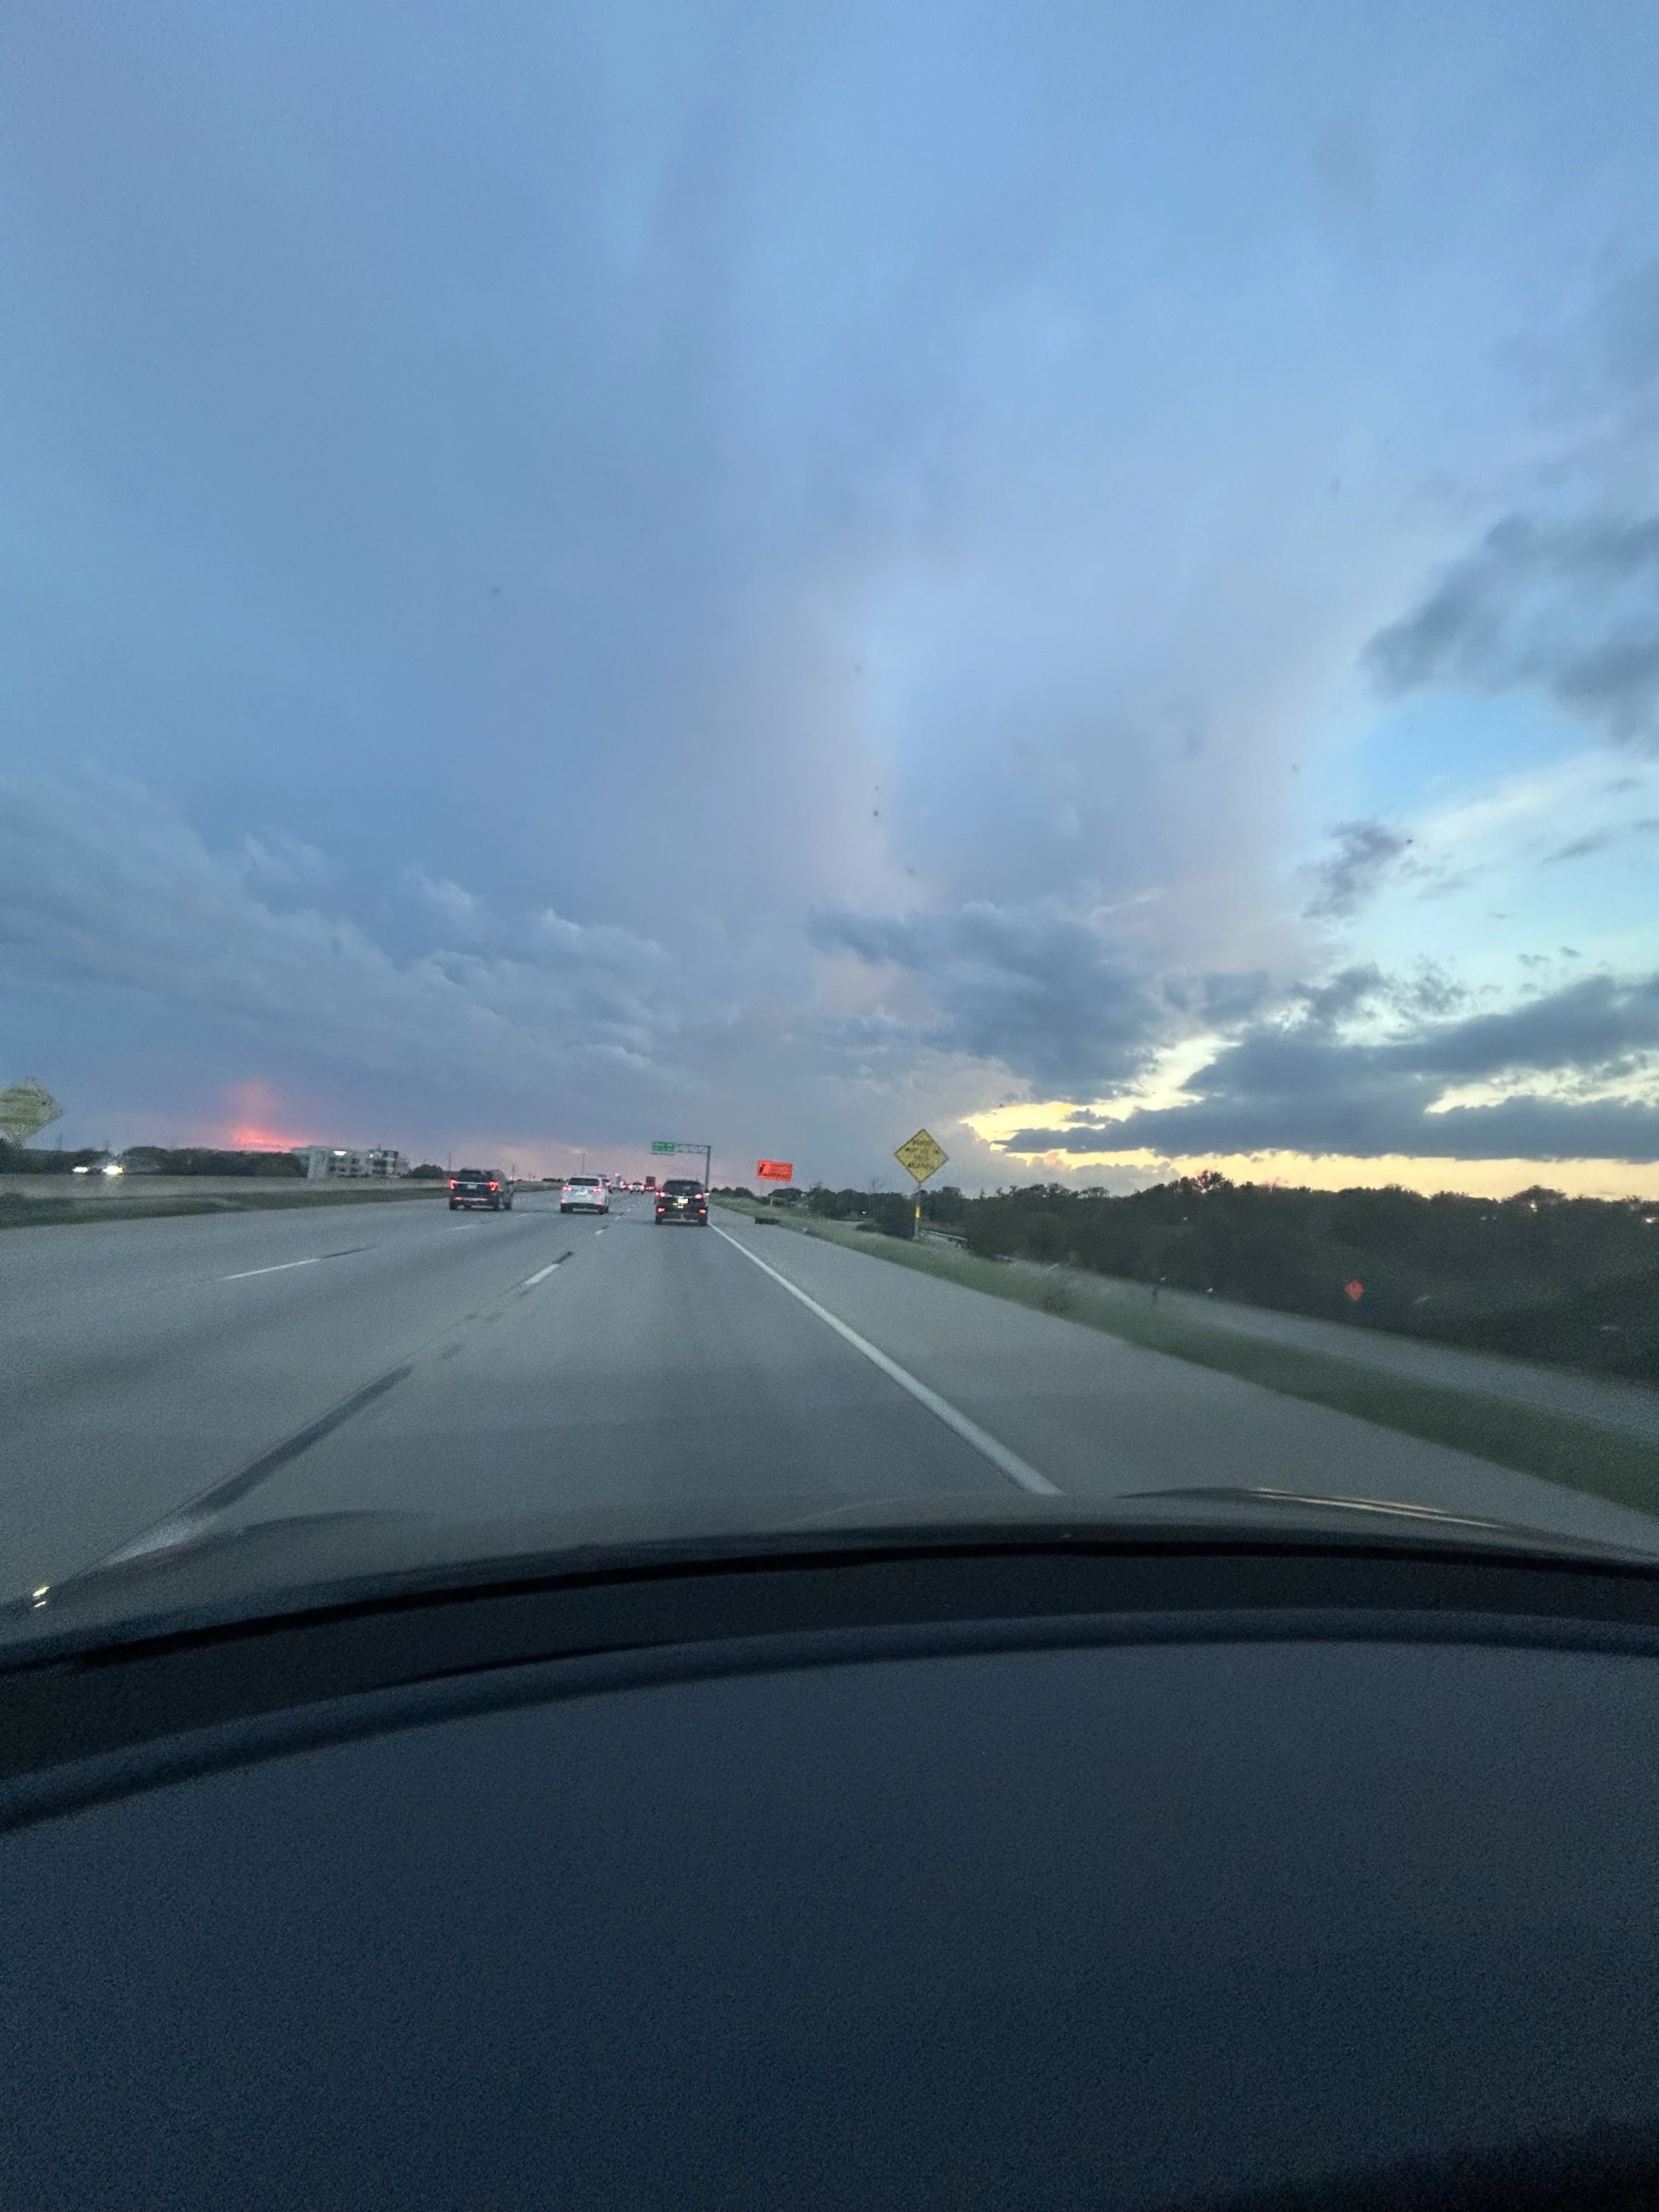
The most important thing you can do to check the weather is to take a good look in every direction before you fly.
Here is a side by side from the last two hours 10a to 12p local time, this is pointing to the Southwest in both pictures. You can see that the clouds have started to rise in altitude, just like the Skew T Chart predicted.
Left: 10a local. Right: 12p local.
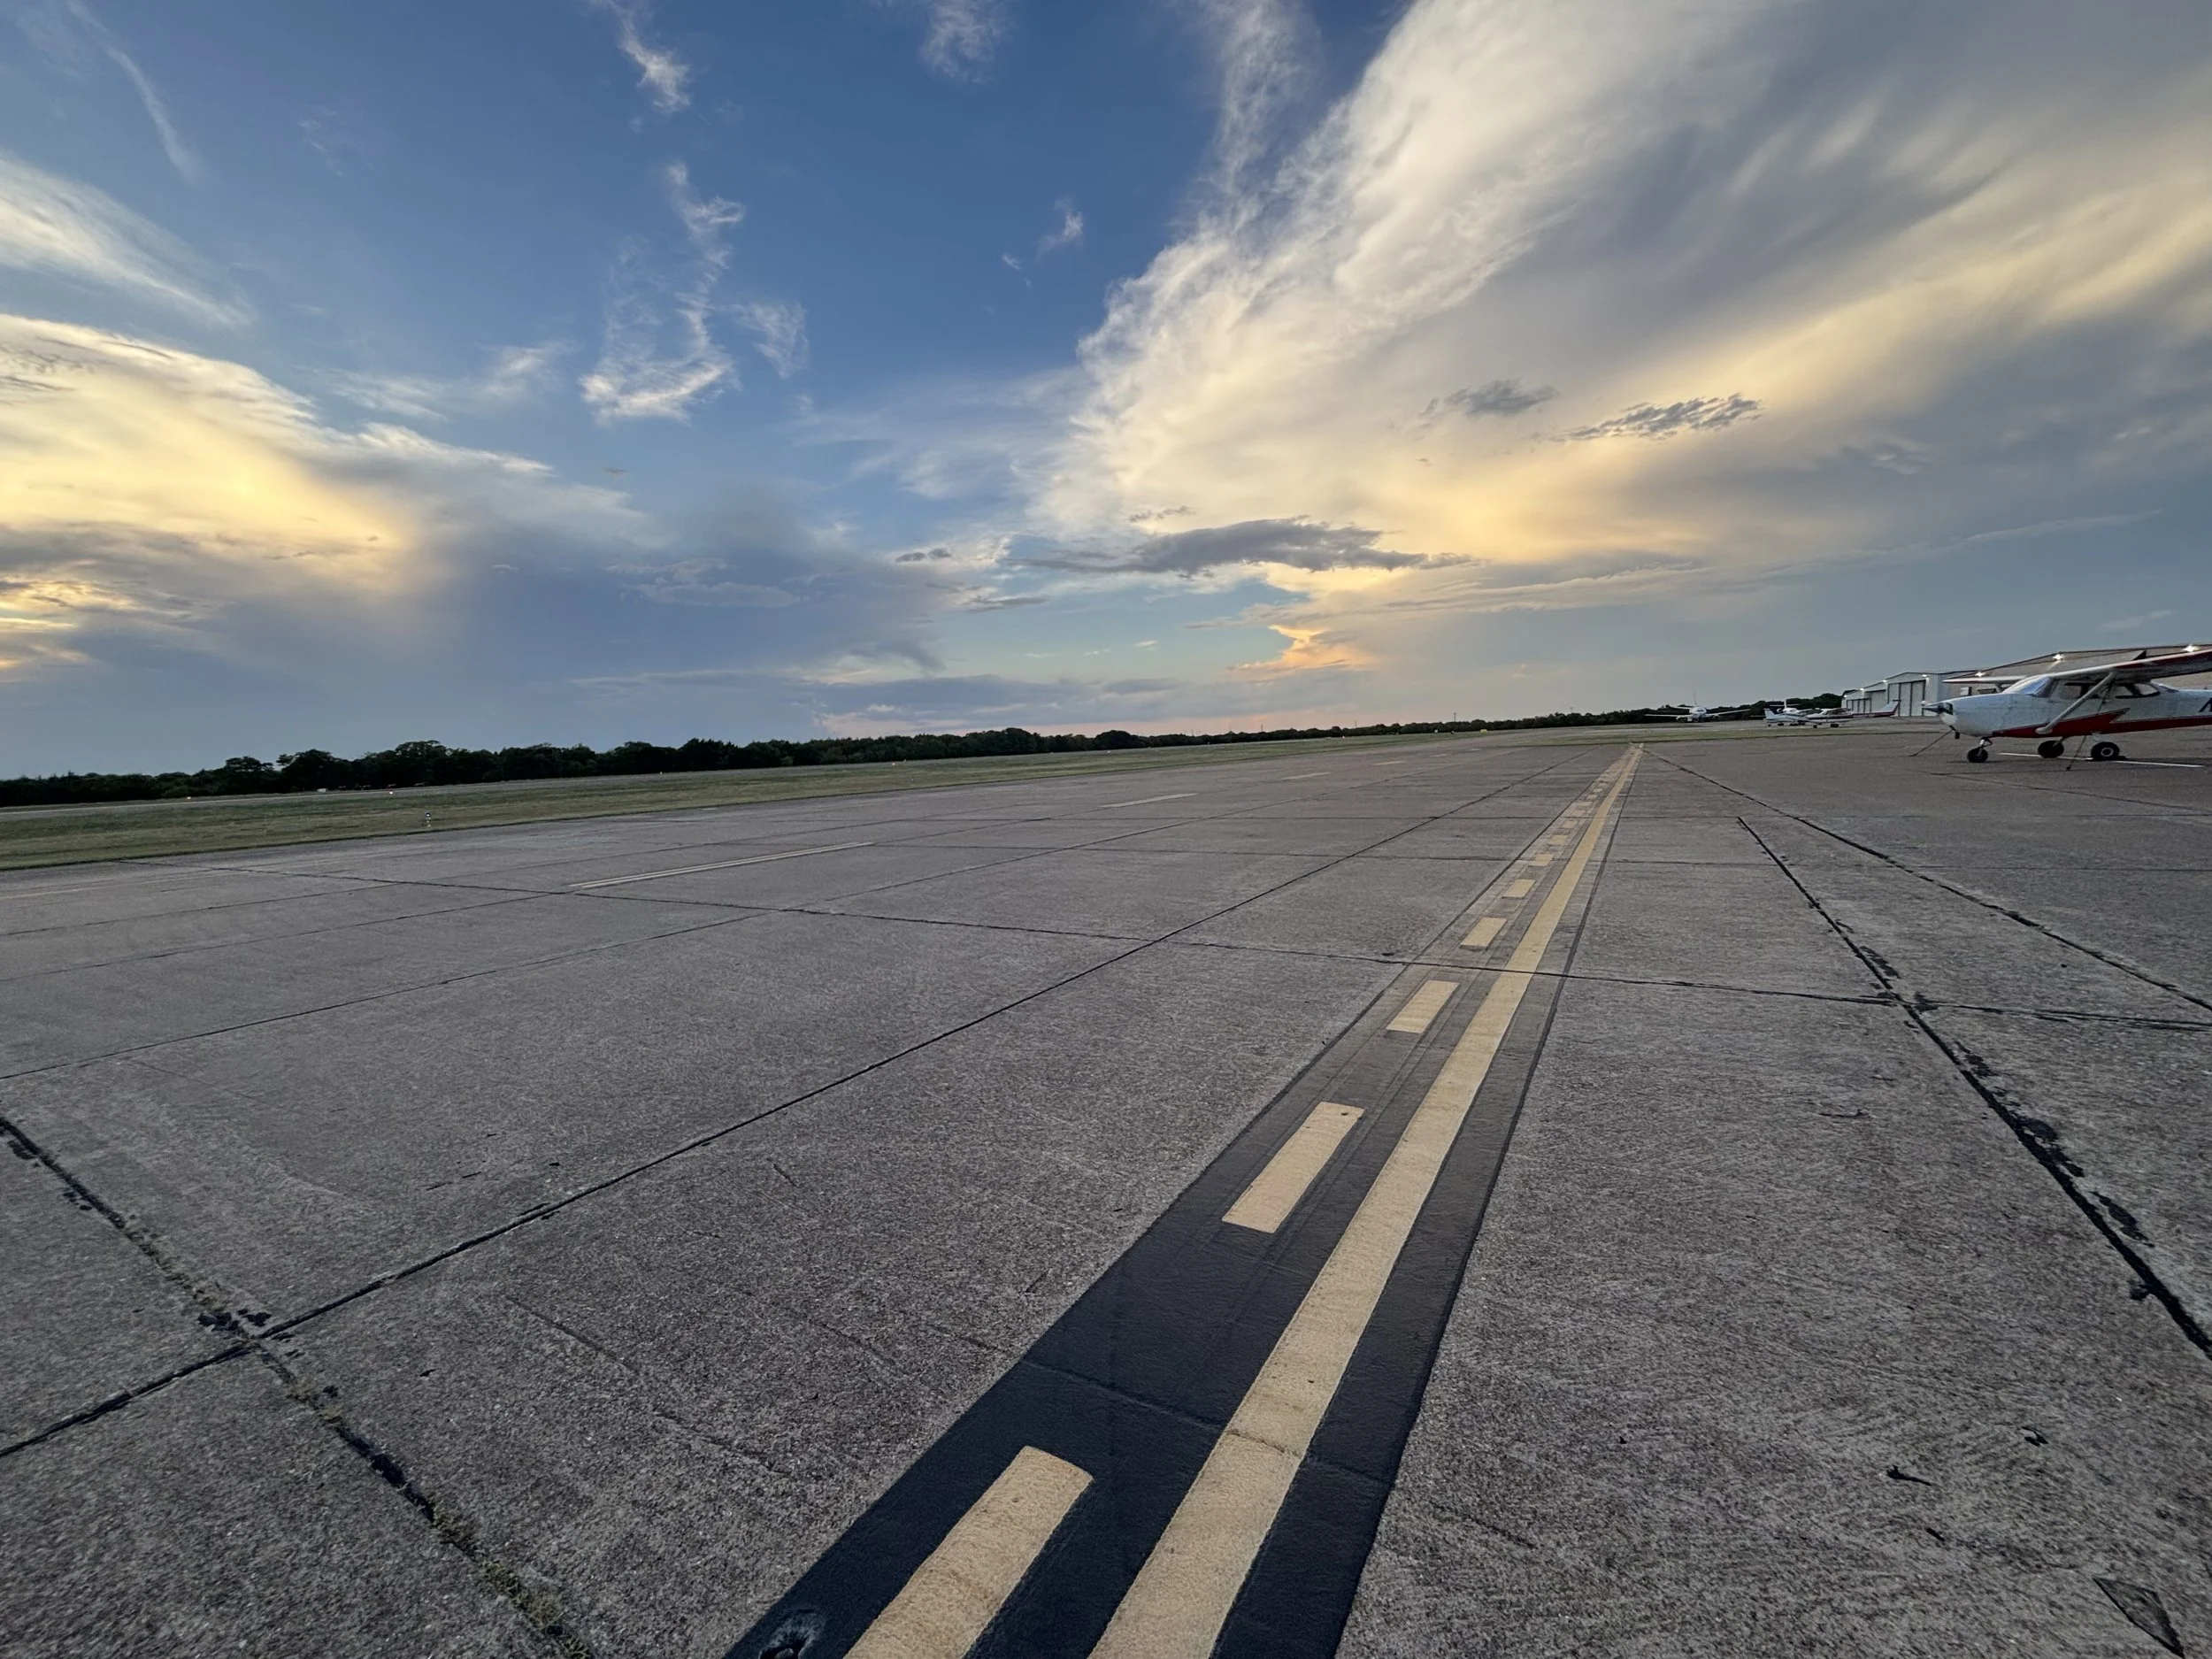
Parrish Aviation looking NorthWest towards the approaching Cold Front.
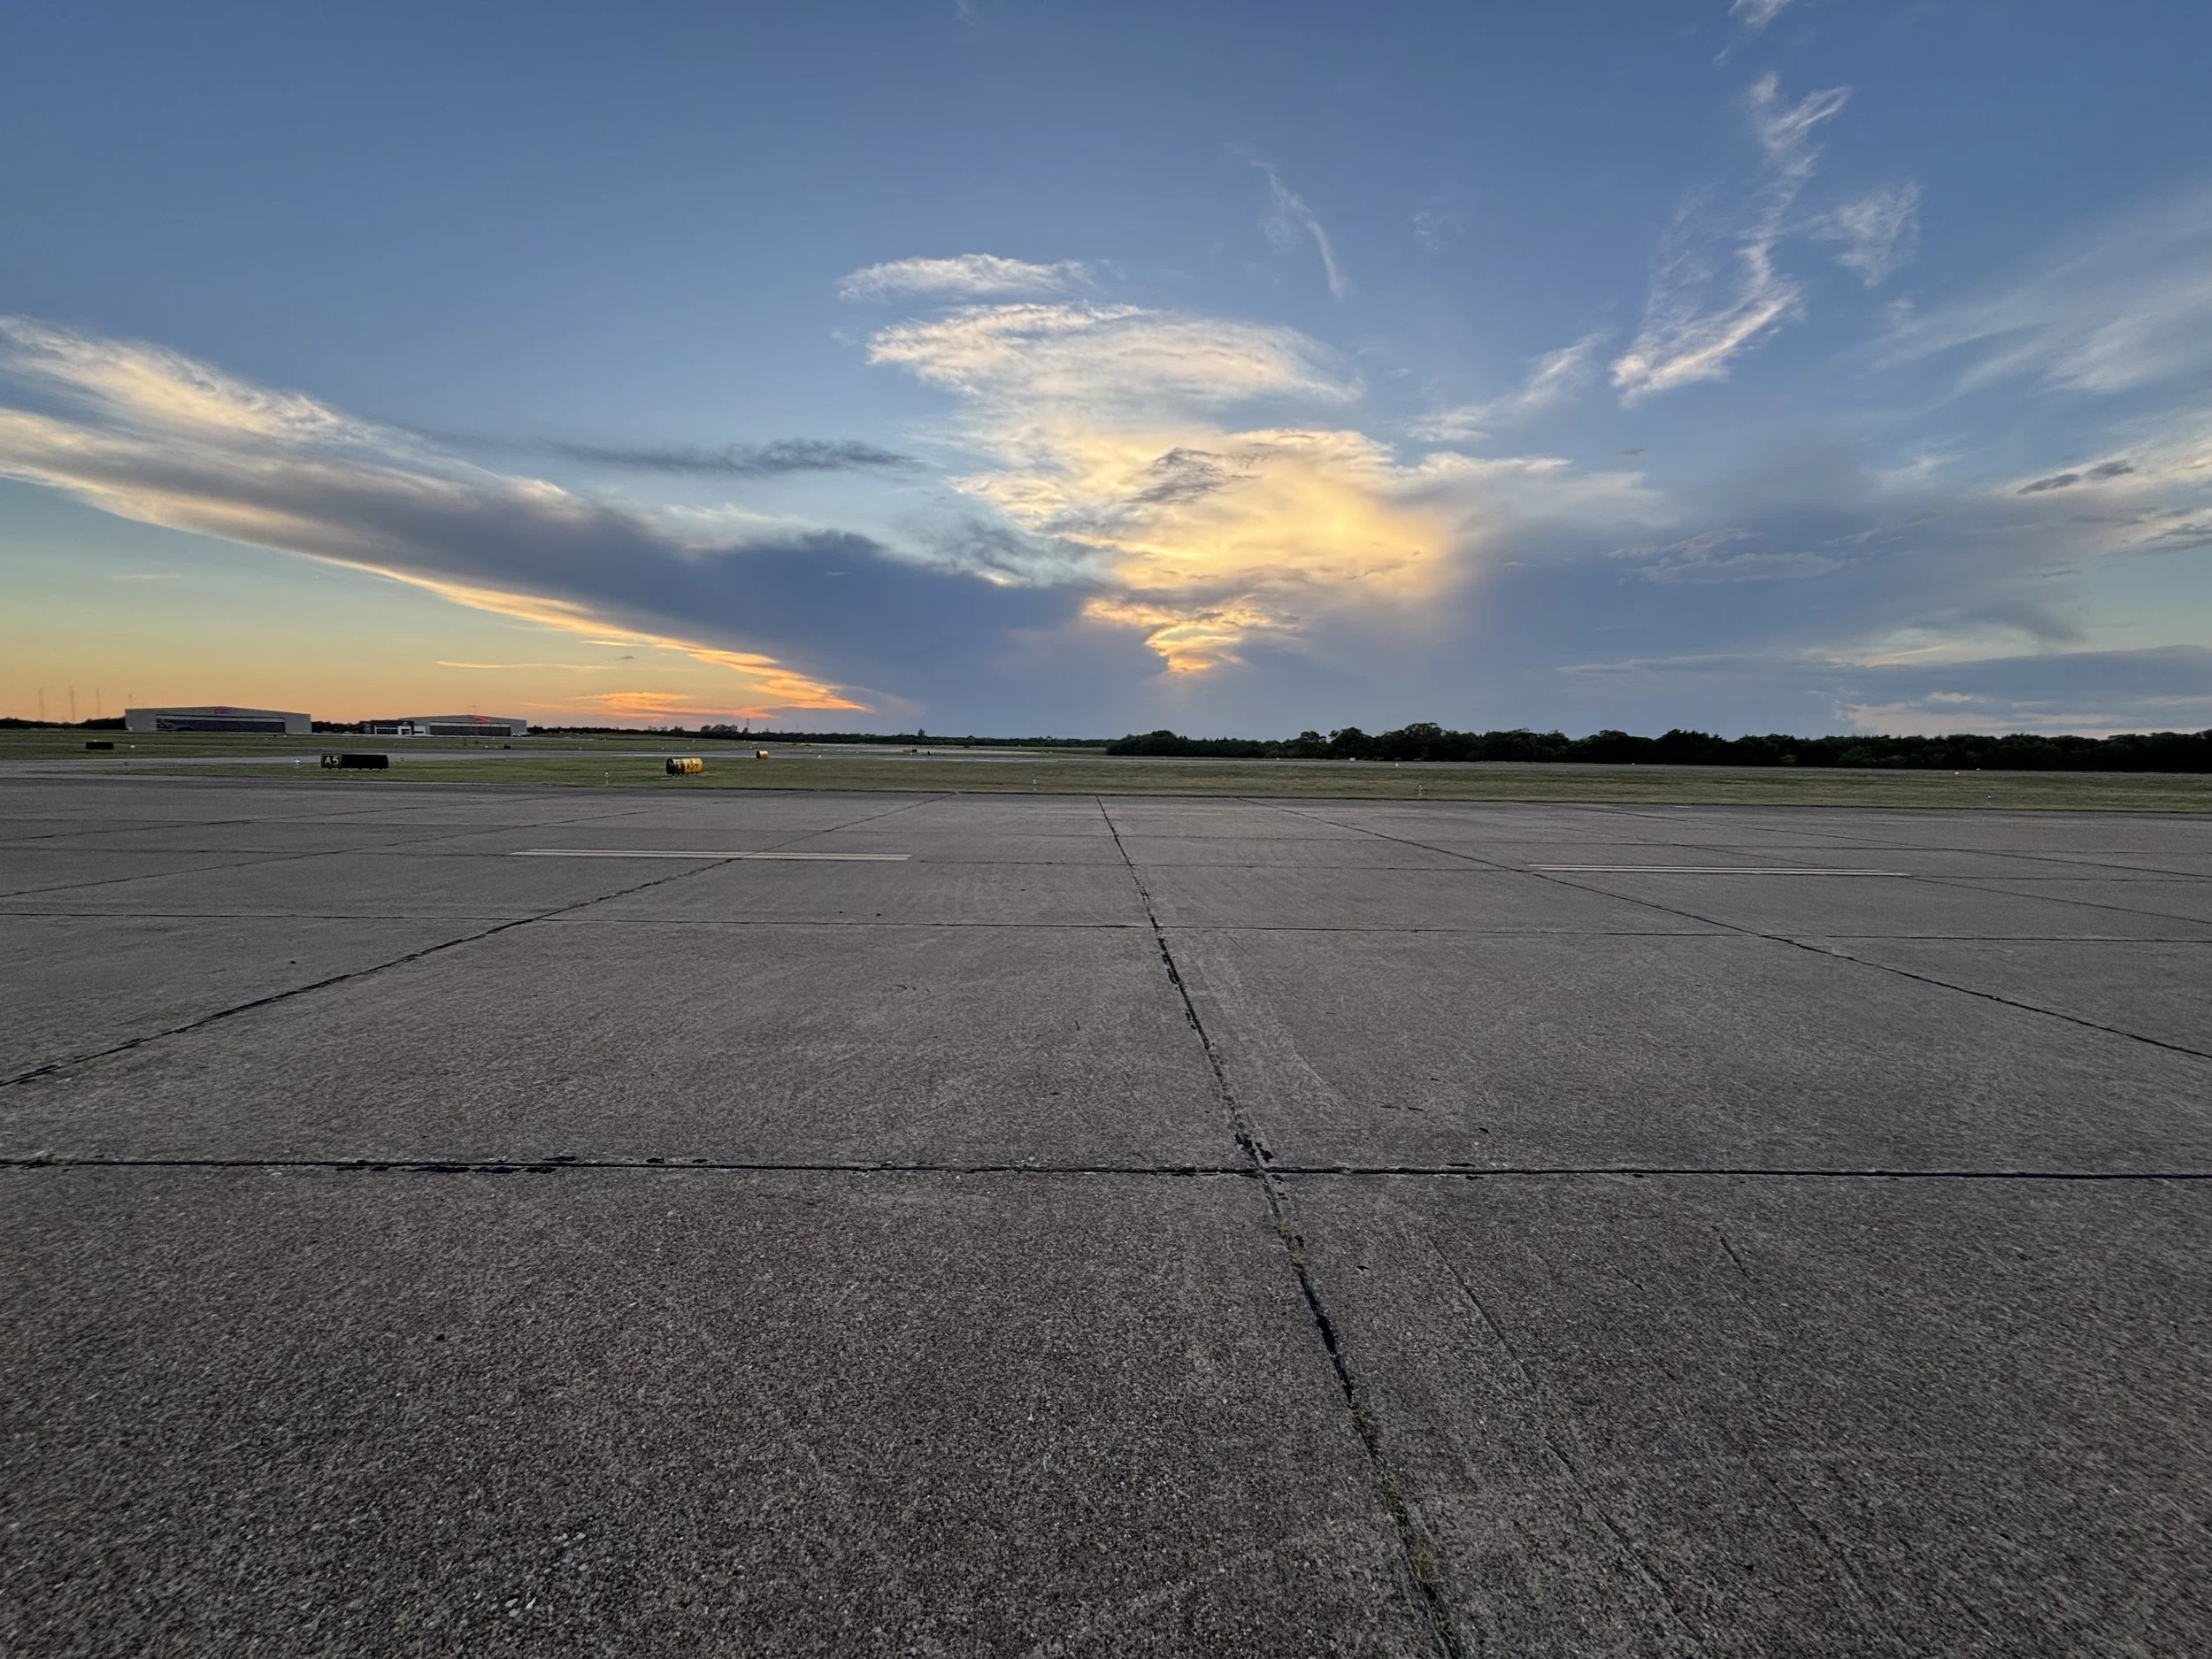
This direction shows the Northwest. The thunderstorms are coming!
Click here to download a pdf of the Weather Interpretation Checklist.
Pictured below: Conditions from later in the evening.
Final Thoughts
Give this a try right now, today. Go look outside and take a picture of the current conditions, and then go through this checklist to discover what conditions have created that sky. After doing this a handful of times, you will begin to develop the skill of looking outside and will have a pretty good idea of what’s going on.
And finally, if you ever need help interpreting a weather source, you can always call a weather briefer at (800) 992-7433.
Blue Skies!

